
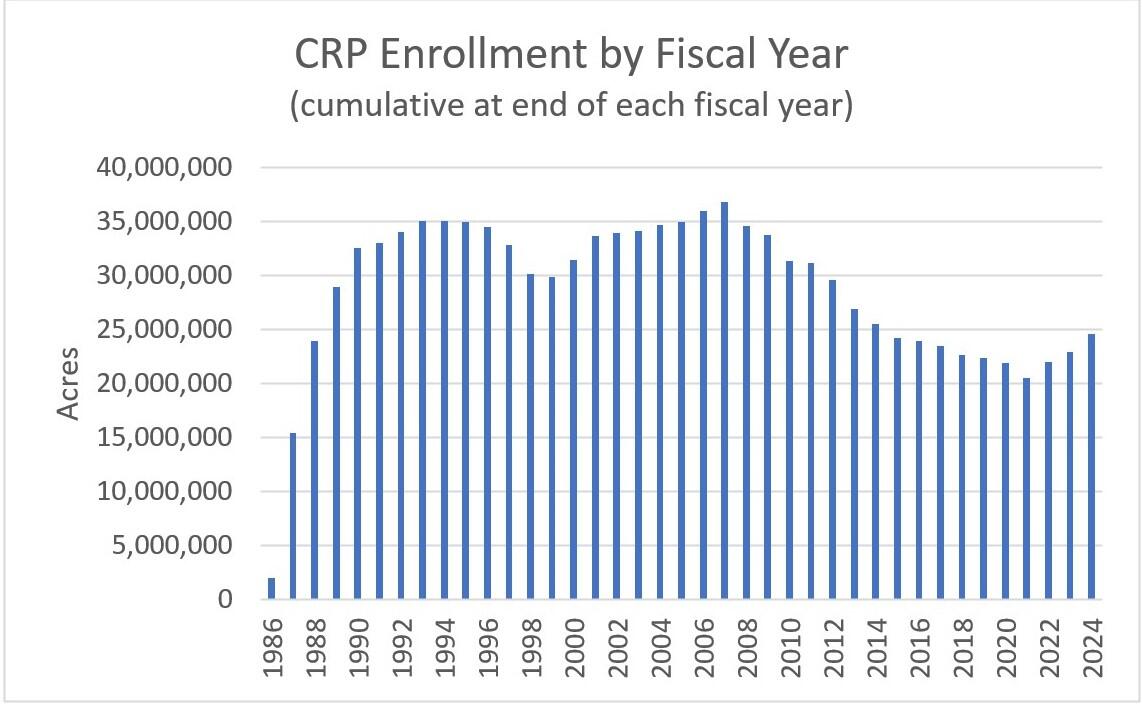
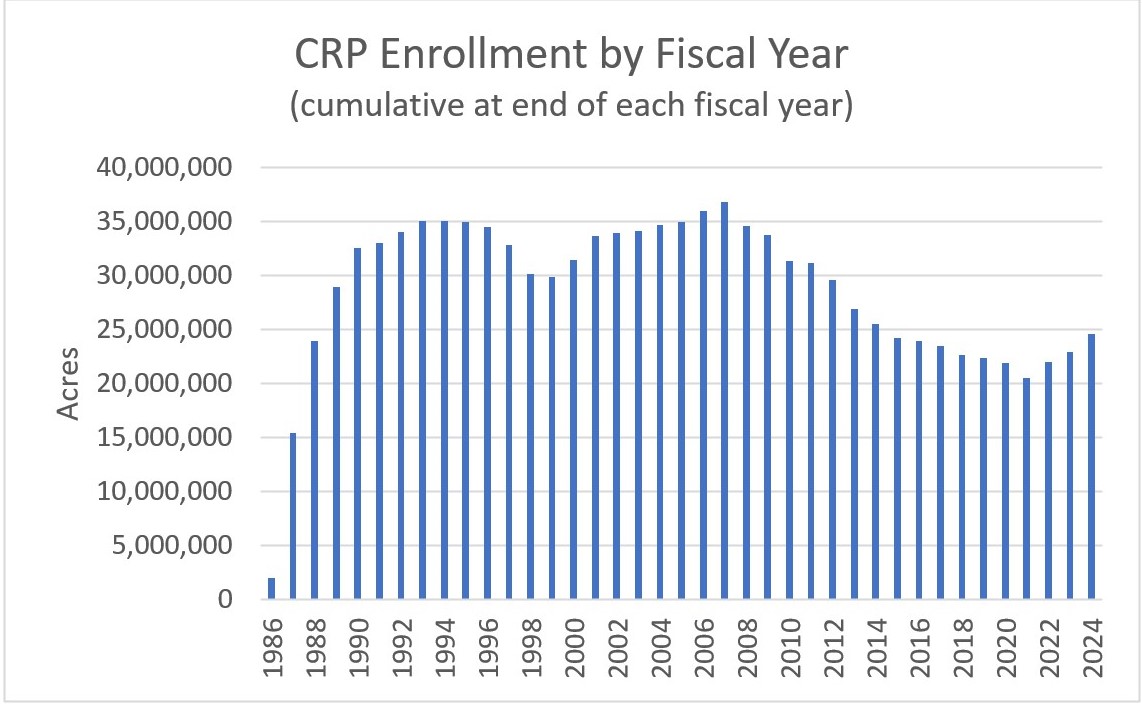
Chart of CRP Enrollment by Fiscal Year
Detailed Description
A U.S. Department of Agriculture Farm Service Agency graph that shows the amount of land that has been enrolled in the Conservation Reserve Program each year between 1986 and 2024. This graph shows the annual fluctuations, as well as 10-year eras that align with contract periods. What the graph does not show is where these lands are located across the United States.
Sources/Usage
Public Domain.