
When Crops Take a Break
Annual NLCD reveals signs of Conservation Reserve Program land: fields shifting to grassland and back again
Agricultural crops are grown on nearly 16% of the land across the lower 48 states. Thanks to the Landsat Satellite Program and the U.S. Geological Survey’s Annual National Land Cover Database (NLCD), we can tell where cropland has remained stable as cropland over the past 39 years. We can also see where it has changed from something else into cropland, or from cropland into something else.
Overall, the amount of cropland has lost ground from 1985 to 2023, dropping from 17.6% to 15.9%. During that same time, about 70% of existing cropland remained stable while the other 30% experienced gains, losses or flux, which refers to land that shifted in and out of cropland use.
Comparing the same location of cropland each year using Annual NLCD reveals patterns of stability and change. Stability can be seen in regions such as the Midwest Corn Belt and the California Central Valley. Cropland gains can be seen in the northern Great Plains, whereas cropland losses are found in the arid southern Great Plains.
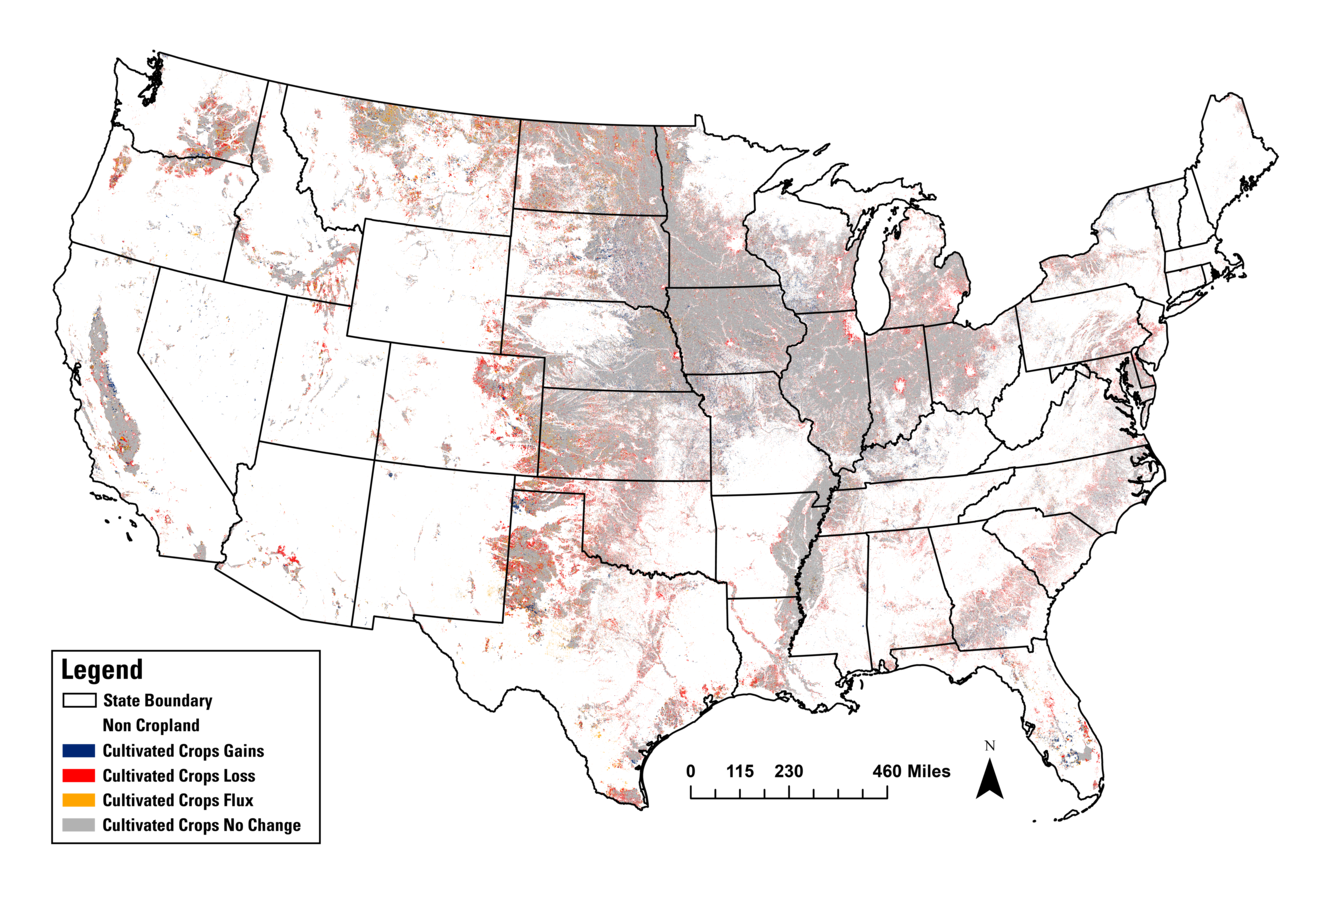
The map above of cropland across the lower 48 states shows cropland gains, losses, flux and stability (no change) from 1985 to 2023, calculated from Annual NLCD data. The gray color represents stable cropland. Red represents areas that lost cropland. Blue represents areas that gained cropland. Orange shows areas in flux, that changed over time from cropland to grassland, typically, and then back to cropland again.
One change agent: Conservation Reserve Program (CRP)
Changes in the amount of cropland can affect society and the land on various levels. Less land in production might reduce the amount of agricultural commodities entering the national and international food systems, but it can also offer environmental benefits.
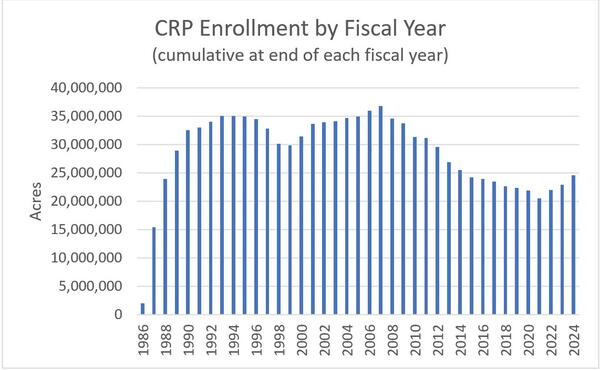
The U.S. Department of Agriculture’s Conservation Reserve Program (CRP) has been one of the largest agents of change in cropland statistics since it was enacted in 1985 and began enrolling land in 1986. The Farm Service Agency (FSA) administers the voluntary CRP program, which compensates farmers and landowners when they take environmentally sensitive cropland out of production. A typical CRP enrollment period is 10 years, during which time organic matter in the soil is rebuilt and the potential for soil erosion is reduced. Instead of crops, the land is planted with grasses, trees and riparian buffers. These habitats are typically more friendly for wildlife.
General agricultural practices may affect water quantity and quality (e.g., Ribaudo, 1989; Spor Leal and others, 2024). Removing lands from production may revitalize soils, reduce erosion and provide wildlife habitat (e.g., Li and others, 2018; Vandever and others, 2021; Gascoigne and others, 2021).
Annual NLCD’s Close View
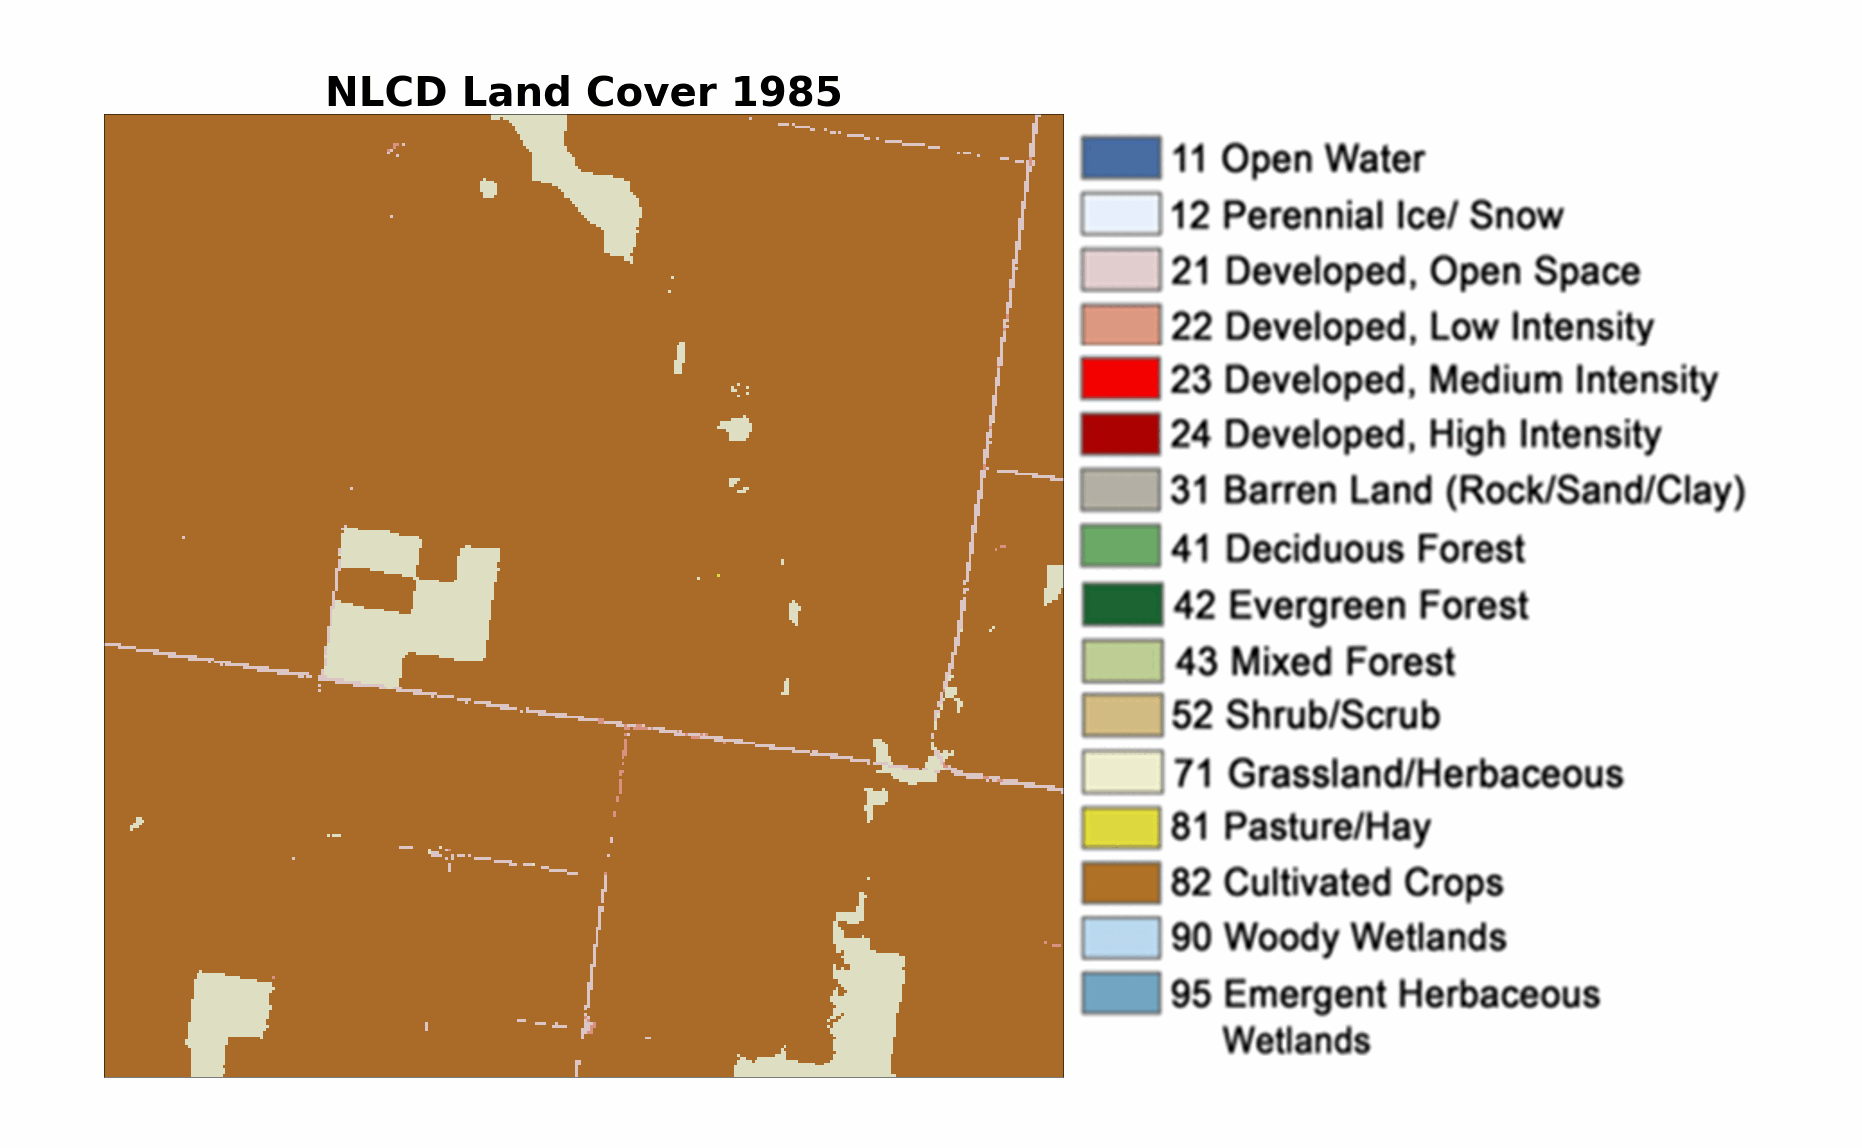
Annual NLCD provides a way to map where cropland is located every year. Studying these annual maps can help understand changes to cropland in how they relate to specific landscapes. As seen below, areas of cropland flux can show how CRP contracts take land in and out of production over time.
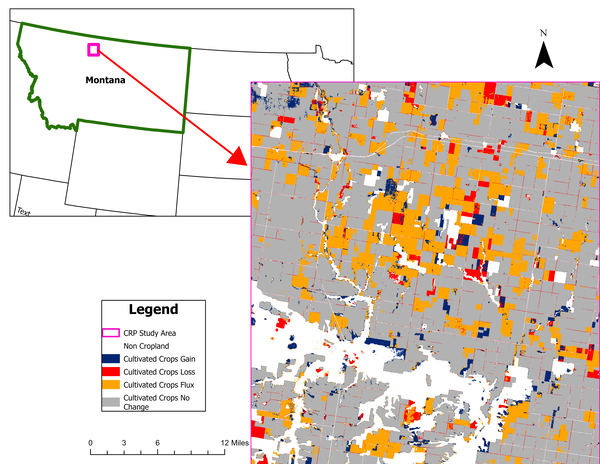
In northern Montana, dryland wheat is a major agricultural crop. Using the close-up view (above) of Annual NLCD land cover data, we see the majority of cropland is stable (gray) in crop production from 1985-2023. What stands out in this region is the amount of cropland that was in flux. CRP contracts are one of the reasons for changes in cropland use in the United States.
The animation below uses Annual NLCD land cover data, 1985-2023, of the same cropland study area in Montana to show the cropland (brown) changing to grassland (yellow and very light tan) and then back to cropland again. These areas of flux represent many fields that likely were enrolled in and then taken out of CRP contracts.
Landsat satellite imagery is Annual NLCD’s base data, and it provides another way to view what is happening on the ground.
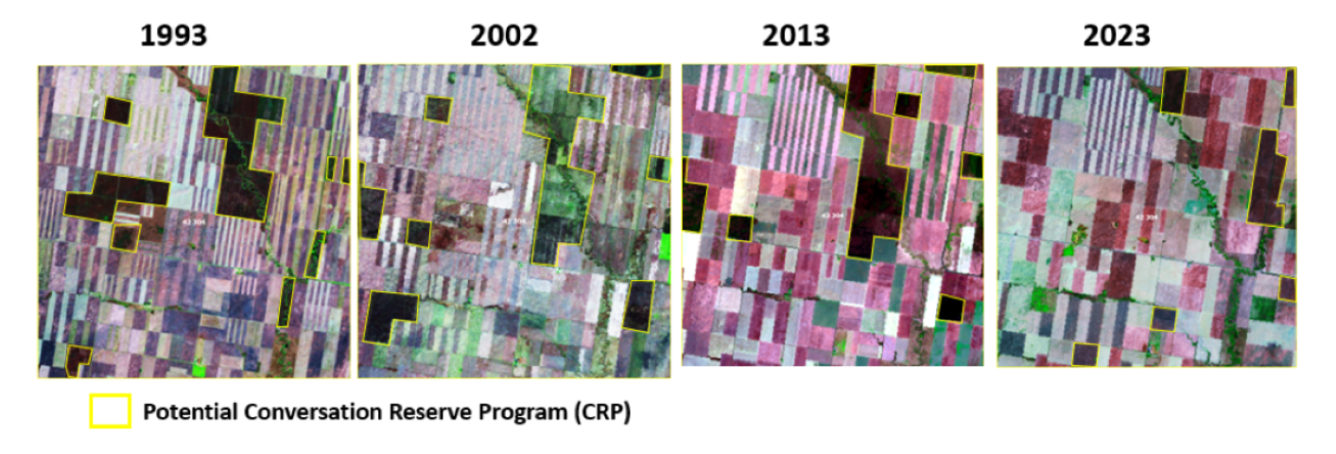
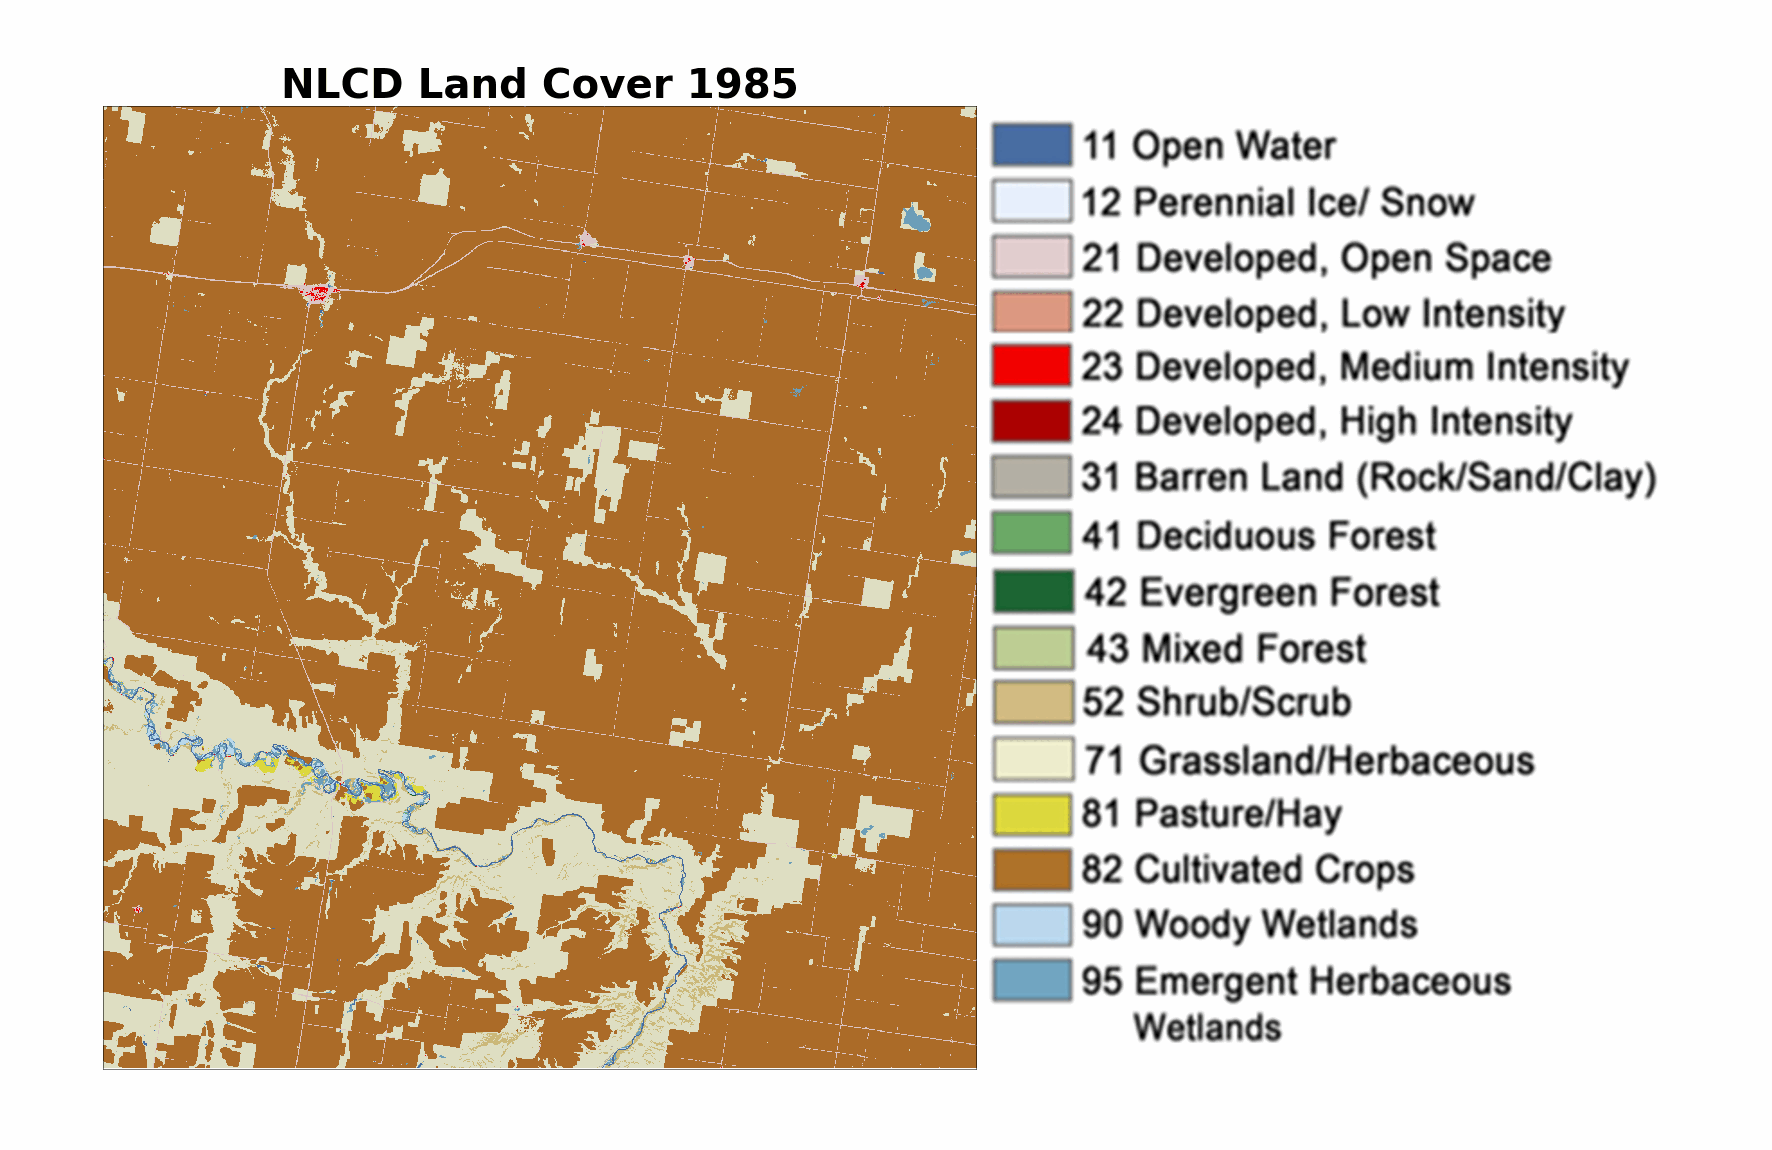
The above imagery of cropland, from the USGS Land Cover Trends project and based on Landsat, is found within the study area in northern Montana. The pattern of alternating stripes is common in a large field of Montana wheat with fallow areas (Aase and Pikiul, 2000). Four select years are shown: 1993, 2002, 2013 and 2023. Areas outlined in yellow highlight grassland, not cropland, that has been identified as being acres possibly related to CRP enrollment. The animation below shows the change for each year between 1985 to 2023, with cropland (brown) changing to grassland (yellow and very light tan) and then back to cropland again.
CRP often became a longer-term rotational aspect of farming in the region and has helped revitalize the soil for future potential crop production.
Overall, the power of USGS sustained satellite observations in remote sensing of the United States and land cover mapping can show the dynamics of land cover change over time, as in agriculture. This lets researchers and citizens better understand various natural resource impacts of land cover and land use change in the United States.
About Annual NLCD
More Land Change Stories
References:
Aase, J.K. and Pikiul, Jr., J.L. 2000. Water use in modified summer fallow system on the semi-arid northern Great Plains. Agricultural Water Management, v. 43:3, 345-357. https://doi.org/10.1016/S0378-3774(99)00062-1
Gascoigne, W., Hill, R., Haefeler, M., Loomis, J. and Hyberg, S. 2021. Economics of the conservation reserve program abd the wildlife it supports: a case study of upland birds in South Dakota. Journal of Outdoor Recreation and Tourism, v.35, 100385. https://doi.org/10.1016/j.jort.2021.100385
Li, C., Fultz, L.M., Moore-Kurcea, J., Acosta-Martinez, V., Kakarla, M., and Weindorf, D.C. 2018. Soil microbial community resttoration in conservation reserve program semi-arid grasslands. Soil Biology and Biochemsitry, v.118, 166-177. https://doi.org/10.1016/j.soilbio.2017.12.001
Ribaudo, M.O. 1989. Water Quality Benefits from the Conservation Reserve Program. USDA, Economic Research Service, Agricultural Economic Report Number 606. Water Quality Benefits From the Conservation Reserve Program | Economic Research Service
Spor Leal, L.B., Roy, T., Uden, D.R., and Schoengold, K. 2024. Hydrological impacts of the conservation reserve program– a mini reviw. Frontiers in Water 6:1506255 Doi:10.3389/frwa.2024.1506255
U.S. Department of Agriculture Farm Service Agency, 2025, CRP chart historical enrollment by fiscal year, accessed February 28, 2025, from https://www.fsa.usda.gov/documents/crp-chart-historical-enrollment-fiscal-year
Vandever, M.W., Carter, S.K., Assal, T.J., Elgersma, K., Wen, A., Welty, J.L., Arkle, R.D., and Iovanna, R. 2021. Evaluating etablishment of conservation practices in the conservation reserve program across the central and western United States. Environmental Research Letters. 16:074011. Doi 10.1088/1748-9326/ac06f8
Related
Learn more about the Annual National Land Cover Database (NLCD).

Annual National Land Cover Database
Annual National Land Cover Database Frequently Asked Questions
Read more articles about a variety of uses of NLCD information.
Annual NLCD Collection 1.2 Now Available Annual NLCD Collection 1.2 Now Available
Related
Learn more about the Annual National Land Cover Database (NLCD).
Annual National Land Cover Database
Annual National Land Cover Database Frequently Asked Questions
Read more articles about a variety of uses of NLCD information.