
Chester Creek streamgage

Detailed Description
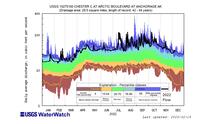
This figure shows flow rates in Chester Creek (Anchorage, Alaska) by month for 2022 (black line) and the range of water flow rates (above and below normal flows shown by different colors) for the entire 44 years of data collection at Chester Creek. The lowest flows are typically in mid-winter (January and February) and the levels rise slowly through spring as snow melts in Anchorage and the Chugach Mountains. The highest flows (peaks in July through September) are typically associated with periods of intense rainfall in late summer and early fall.
All information collected by the gage can be viewed here: https://waterdata.usgs.gov/monitoring-location/15275100.
Sources/Usage
Public Domain.
U.S. Geological Survey