
Coastal Response Likelihood Workflow
By Woods Hole Coastal and Marine Science Center
April 2026 (approx.)
Detailed Description
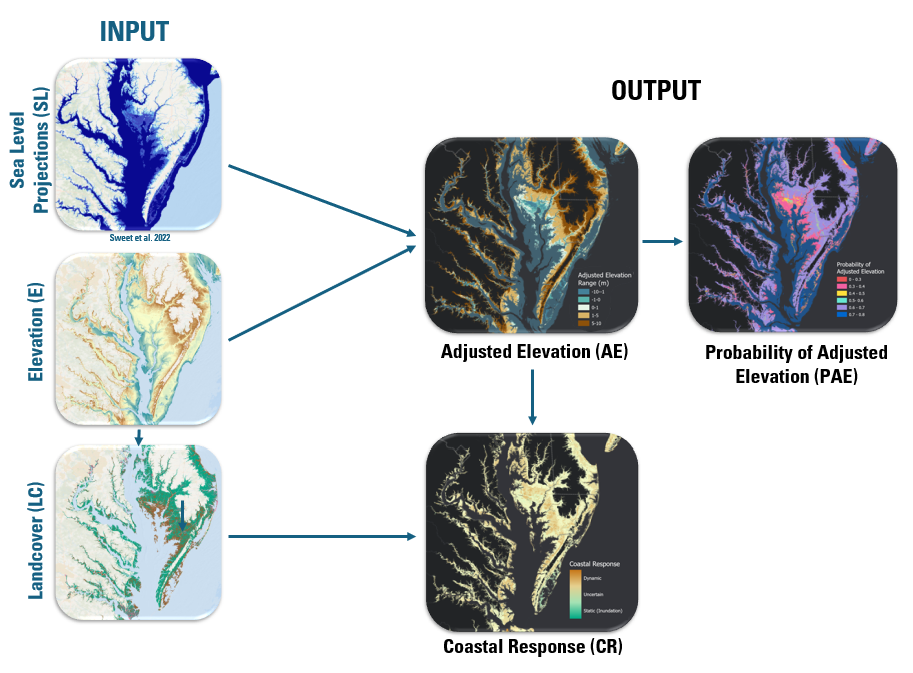
Conceptual diagram showing the structure of the Bayesian network used to assess potential sea-level rise impacts on the coastal landscape. Here relative sea-level projections (SL) and elevation (E) are the driving forces, land cover (LC) is the boundary condition, and coastal response type (CR), adjusted elevation (AE), and the probability of adjusted elevation (PAE) are the sea-level rise response variables and model outputs. AE predictions and LC are related through expert knowledge to produce CR predictions.
Sources/Usage
Public Domain.
Related

Coastal Landscape- Change Predictions
Sea-level rise (SLR) impacts on the coastal landscape are presented here as: 1) level of landscape submergence (adjusted land elevation with respect to projected mean high water levels); and 2) coastal response type characterized as either static (for example, inundation) or dynamic (for example, landform or landscape change). Results are produced at a spatial scale of 10 meters for four decades...
Related
Coastal Landscape- Change Predictions
Sea-level rise (SLR) impacts on the coastal landscape are presented here as: 1) level of landscape submergence (adjusted land elevation with respect to projected mean high water levels); and 2) coastal response type characterized as either static (for example, inundation) or dynamic (for example, landform or landscape change). Results are produced at a spatial scale of 10 meters for four decades...