
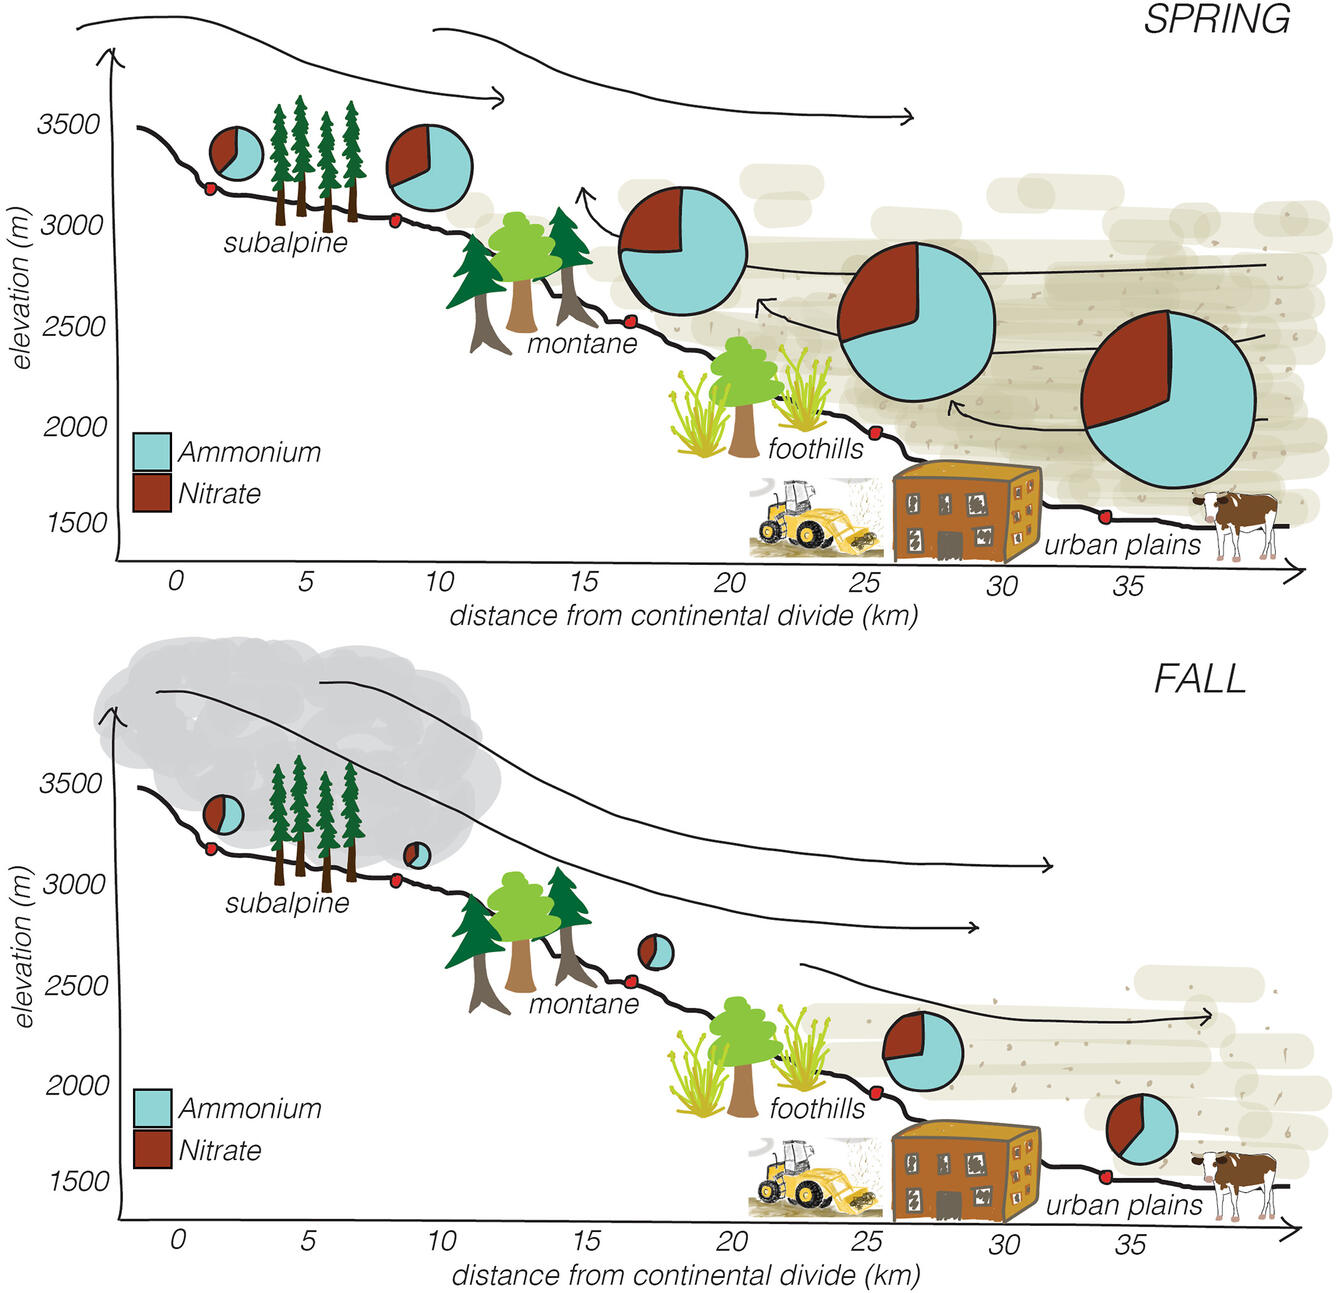
Conceptual diagram showing seasonality of air mass transport and bulk Nr deposition
By Ecosystems Mission Area
2022 (approx.)
Detailed Description
Conceptual diagram showing the seasonality of air mass transport and bulk Nr deposition. Bulk deposition pie charts show values from the spring and fall of 2019 and are scaled according to total deposition. From https://agupubs.onlinelibrary.wiley.com/doi/10.1029/2021EF002373
Sources/Usage
Public Domain.
Related

Connections between Forested and Urban Landscapes and Implications for Water Supply
Downstream communities rely upon forested mountains for high-quality water needed for water supply and agricultural irrigation. However, these forests are vulnerable to disturbances such as wildfire, drought, and flood, and are also affected by air pollution from adjacent urban and agricultural lands. Interactions between forested, urban, and agricultural landscapes can have substantial impacts on...
Related
Connections between Forested and Urban Landscapes and Implications for Water Supply
Downstream communities rely upon forested mountains for high-quality water needed for water supply and agricultural irrigation. However, these forests are vulnerable to disturbances such as wildfire, drought, and flood, and are also affected by air pollution from adjacent urban and agricultural lands. Interactions between forested, urban, and agricultural landscapes can have substantial impacts on...