



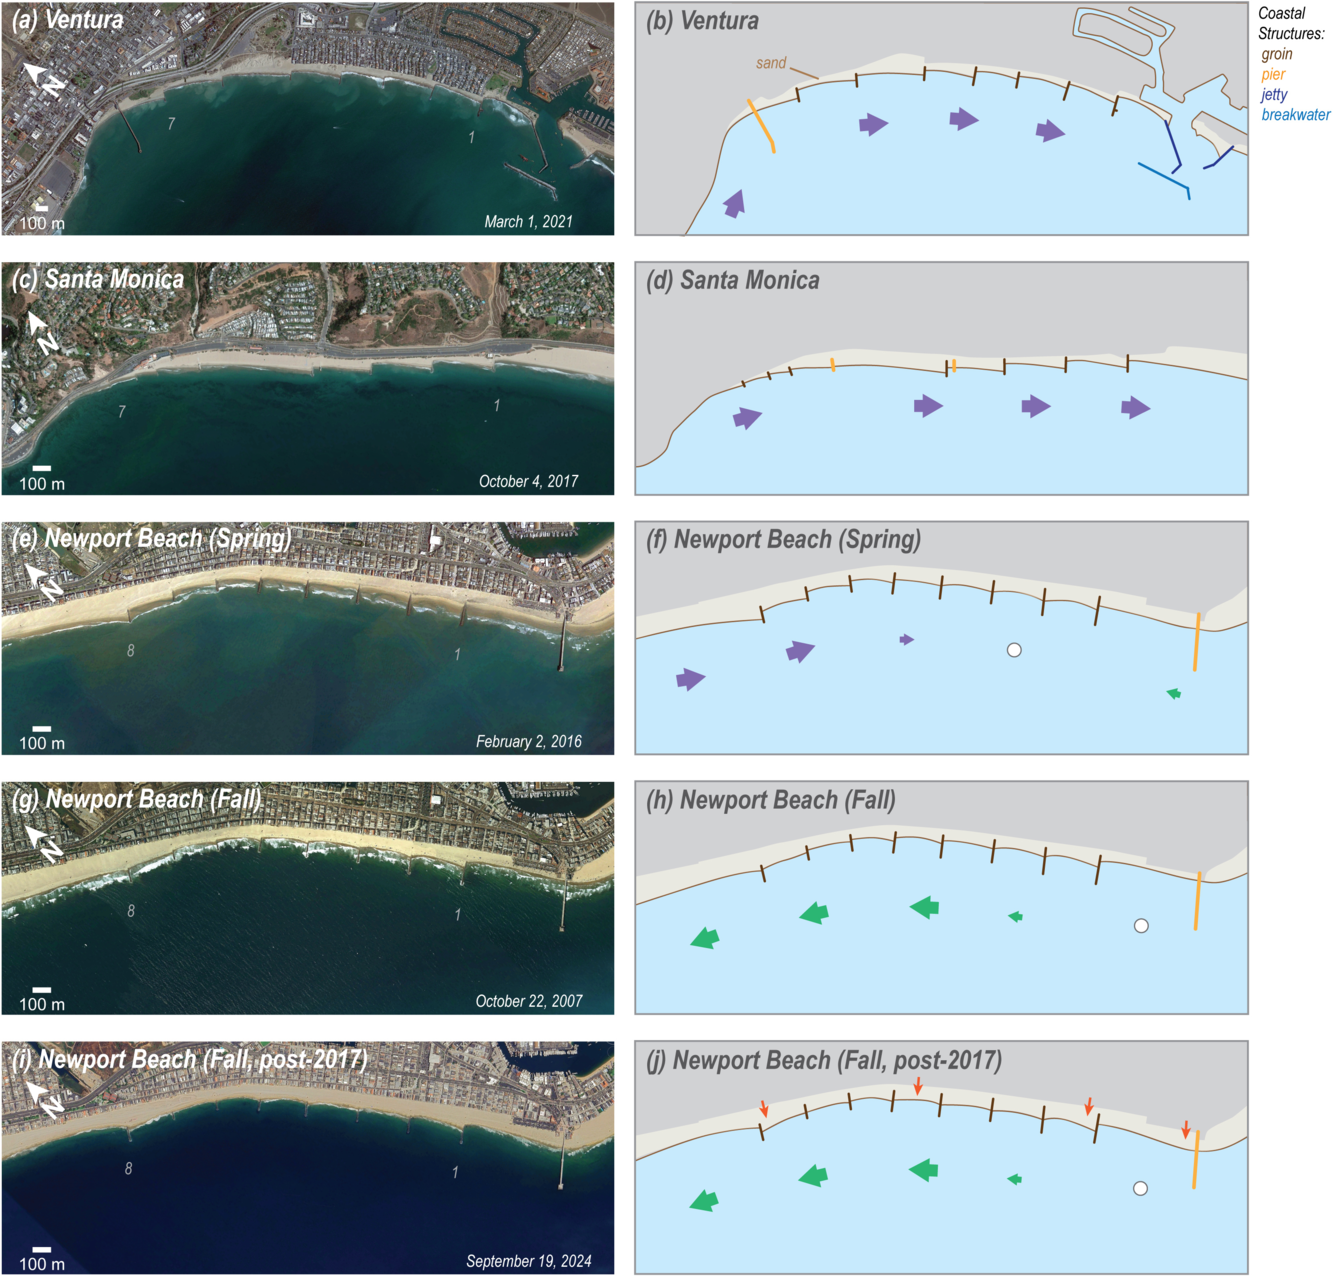
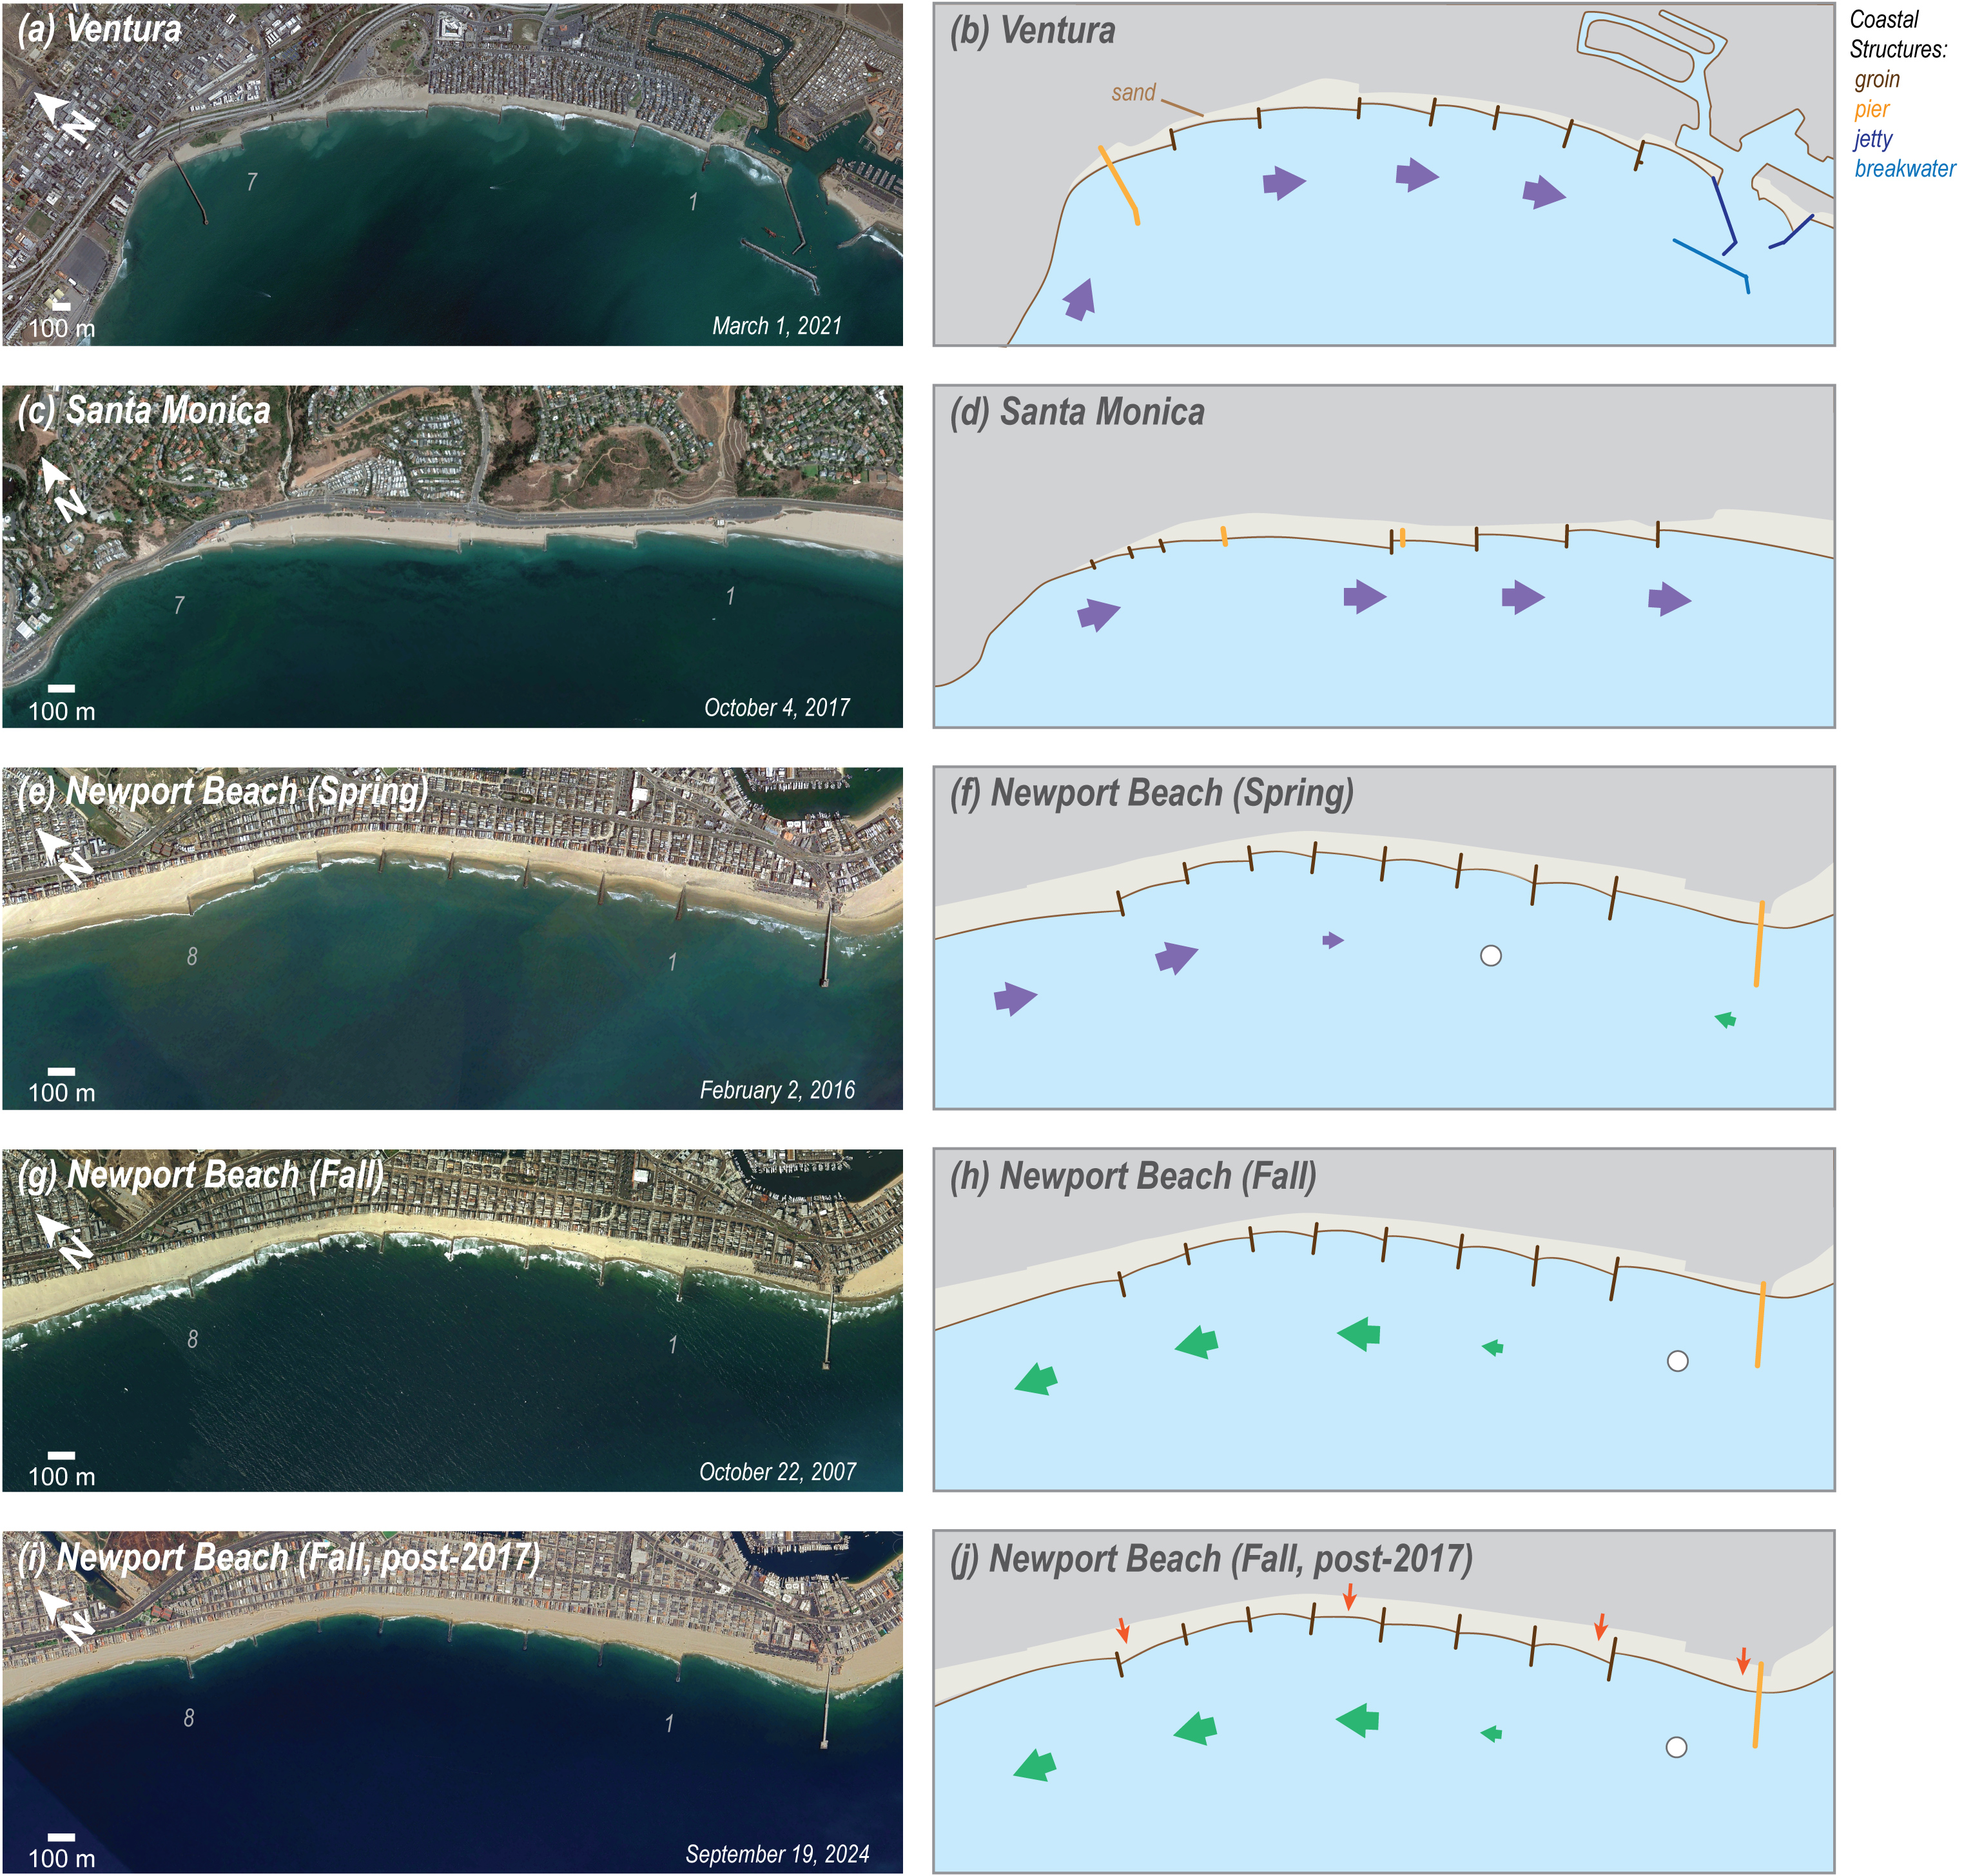
Conceptualization of observed longshore transport and shoreline patterns around groin fields at each study site in Southern California


Detailed Description
Conceptualization of observed longshore transport and shoreline patterns around groin fields at each study site in Southern California. Conceptualization of observed longshore transport and shoreline patterns around groin fields at each site. Left panels (a,c,e,g,i) show satellite images from Google Earth for each site with the date of each image shown in the bottom right corner. Right panels (b,d,f,h,j) show drawings of each site with longshore transport shown as arrows. Purple arrows denote southerly transport while green arrows denote northerly transport. Arrow size is relative to the magnitude of the longshore transport and is not to scale. White dots correspond to areas of transitional directions. Red arrows shown in panel (j) highlight the new pattern Newport Beach obtained after 2016–2017. From the study Shoreline Behavior at California Groin Fields from Satellite-Based Measurements.
Sources/Usage
Public Domain.