
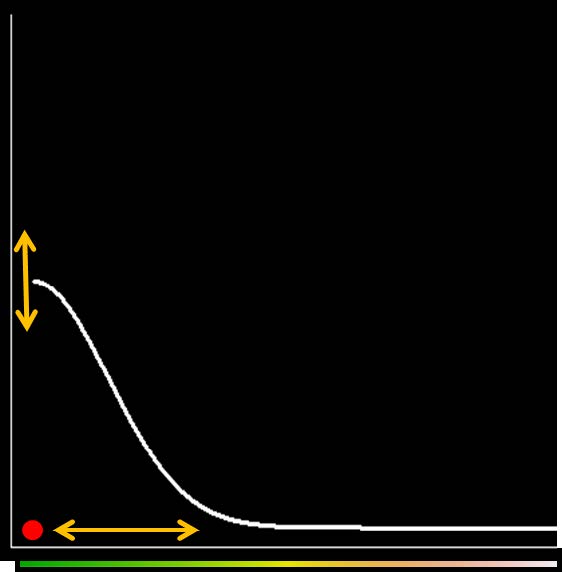
Distance from trap to activity center

Detailed Description
Fig. 2. Frequency of detection decreases with distance between trap and activity center. The color bar at the bottom of the figure depicts this relationship for one of the individuals in Fig. 1.