
Earthquake Rates - Past Month Mauna Loa
By Mauna Loa
2019 (approx.)
Detailed Description
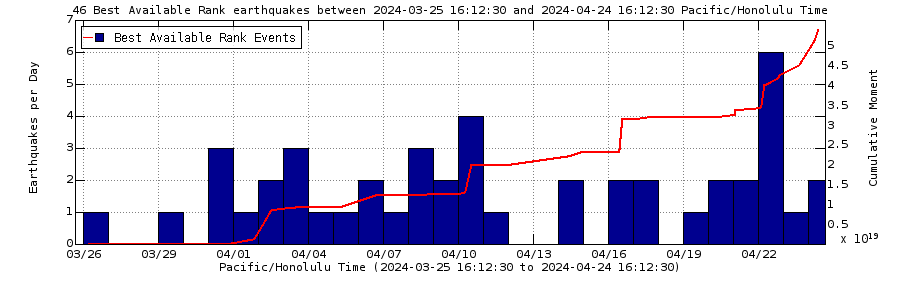
Earthquake Rates - Past Month Mauna Loa. Number of earthquakes per day during the past month (blue bars). The red line is the cumulative moment (energy) release.
Sources/Usage
Public Domain.