
Earthquakes at Long Valley Caldera 1984 to present
By Long Valley Caldera
2019 (approx.)
Detailed Description
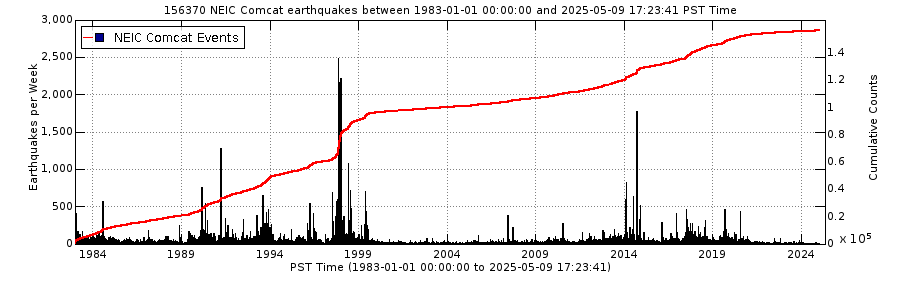
The vertical bars on the graphs below correspond with the left-side y-axis and represent the number of earthquakes per day. The red line indicates the cumulative number of earthquakes and corresponds with the right-side y-axis. Earthquake swarms occurred at Long Valley from 1978-1983, 1990-1995, 1996, and 1997-1998. The rate of earthquakes since the end of the last swarm has been relatively low considering the history since seismic monitoring started.
Sources/Usage
Public Domain.