
Examples of Hawaii geologic maps
Detailed Description
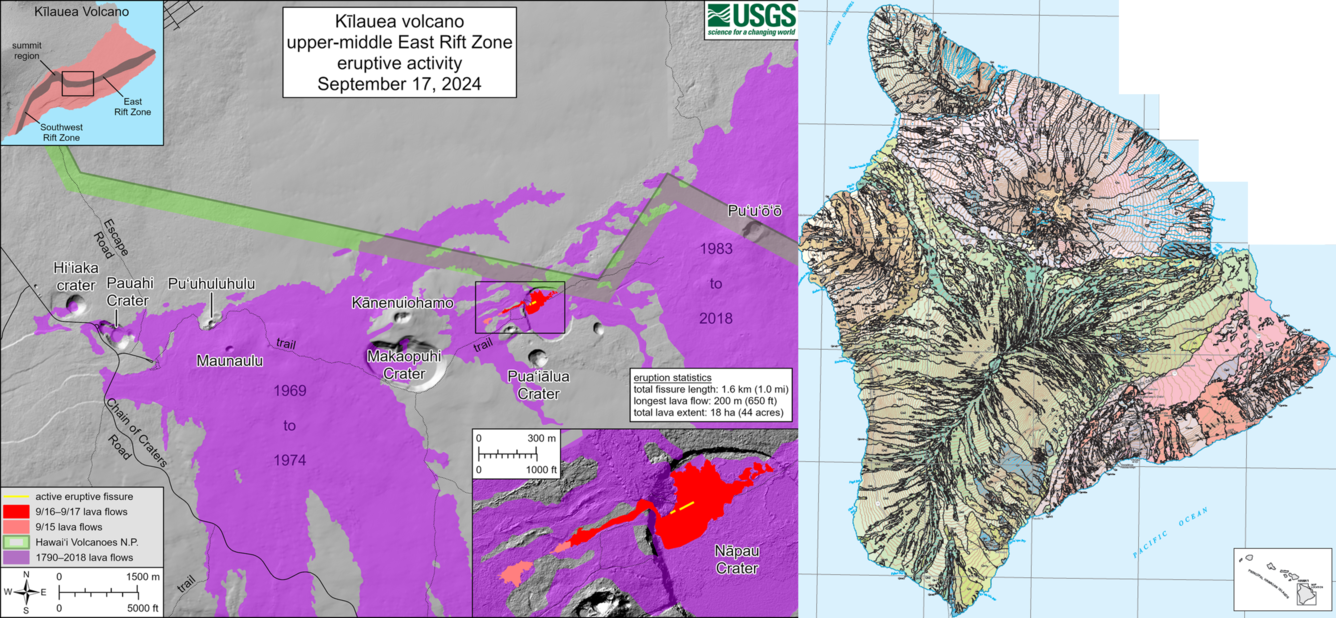
Examples of Hawaii geologic maps. The lefthand map is a USGS Hawaiian Volcano Observatory map created on September 17, 2024, within hours of remote sensing (helicopter overflight) of the eruption that occurred from September 15–20, 2024. Several age ranges for lava flows of interest are noted by color changes, with those that erupted from 1790–2018 in purple (older lava flows are gray), those erupted on September 15 in pink, and those erupted September 16–17 in red (with the active fissure as a yellow line). This map also shows roads and the boundary of Hawaiʻi Volcanoes National Park, as these would be of interest to those using this map. The righthand geologic map is that of the Island of Hawaiʻi from the Geologic Map of the State of Hawaii by Sherrod and others (2021). This map was compiled through decades of work and displays the various lava flows, tephra deposits, and other rock and sediment types mapped through fieldwork and remote sensing. The primary purpose of this geologic map is to show all mappable geologic units with their colors denoting their source volcano and age. This map is free to download at https://pubs.usgs.gov/publication/sim3143.
Sources/Usage
Public Domain.