
FIM Library creation, Step 4, Computing depths of flood inundation

Detailed Description
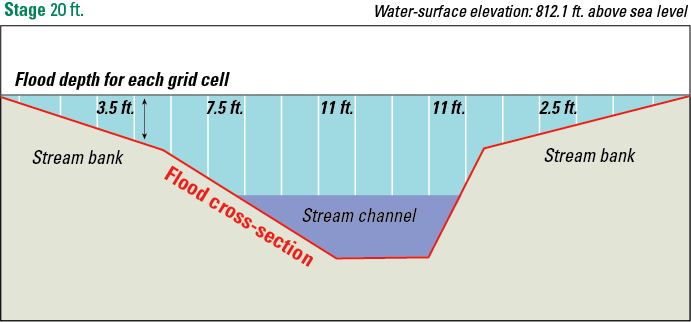
Figure 5. This diagram shows how flood depths are calculated along one of the cross-sections from the previous figure. The purple area is shows the cross-section of a normal stream (contained in its channel), and the light blue shows flood waters overtopping the channel banks and spreading out. The water depth (water-surface to ground) is calculated for each aerially-defined grid cell, illustrated here by the white lines.
Sources/Usage
Public Domain.
Related
Flood Inundation Mapping Science
When planning for a flood, there are three key questions that must be answered: What areas will be flooded? How deep will the floodwaters get? When will the flood arrive? A flood inundation map library is a set of maps that together show where flooding may occur – and how deep it may be - over a range of potential flooding scenarios in a stream or river.