
Flowchart Diagram for Selection of Sediment Acoustic Methods

Detailed Description
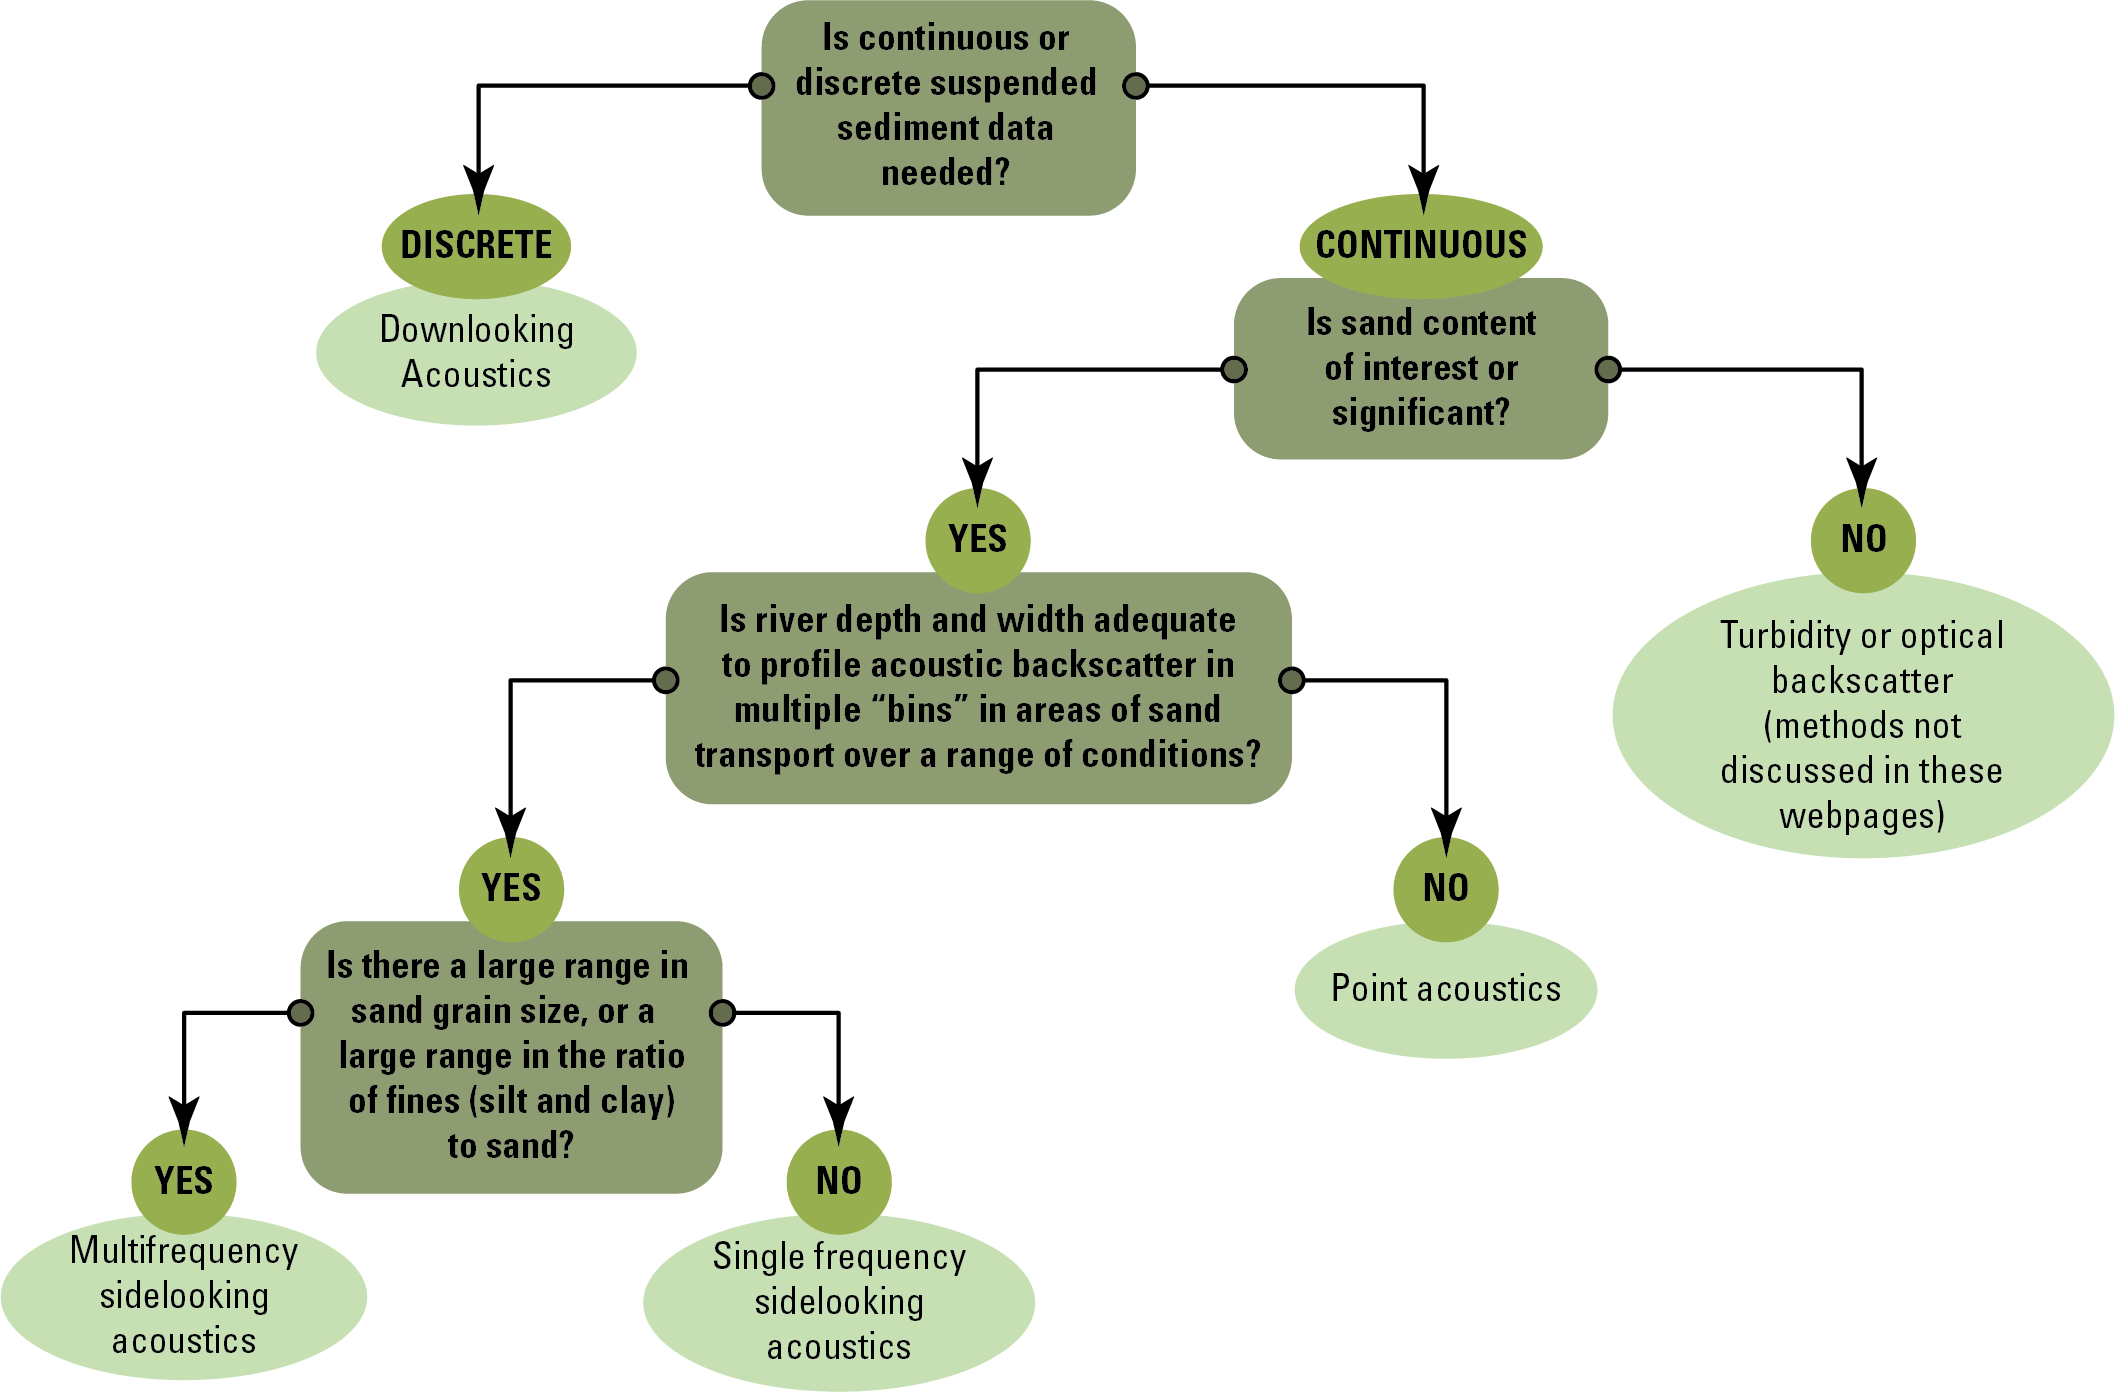
Decision support flowchart to guide selection of sediment-acoustic methods. A series of questions and answers help to guide potential sediment acoustic users with decision support when selecting the applicable sediment acoustic method.
This illustration depicts a flowchart with a series of questions and answers to help guide potential sediment acoustic users with decision support when selecting the applicable sediment acoustic method. At the top of the illustration, the first question says, “Is continuous or discrete suspended sediment data needed?”. To the left, it is “DISCRETE” with the method “Downlooking Acoustics” below. To the right, it says “CONTINUOUS” and below the next question says, “Is sand content of interest or significant?” To the right is “NO” and the method below is “Turbidity or optical backscatter (methods not discussed in these webpages)” to the left of continuous is “YES” with the next question below being “Is river depth and width adequate to profile acoustic backscatter in multiple ‘bins’ in areas of sand transport over a range of conditions?”. To the right is “NO” and the method is “Point acoustics” below and to the left is “YES” with the next question below being “Is there a large range in sand grain size, or a large range in the ratio of fines (silt and clay) to sand?” to the right is “NO” and the method below is “Single frequency sidelooking acoustics” and to the left is “YES” and the method below is “Multifrequency sidelooking acoustics.”
Sources/Usage
Public Domain.