
Four radar interferograms (InSAR data) superimposed on digital terrain
Detailed Description
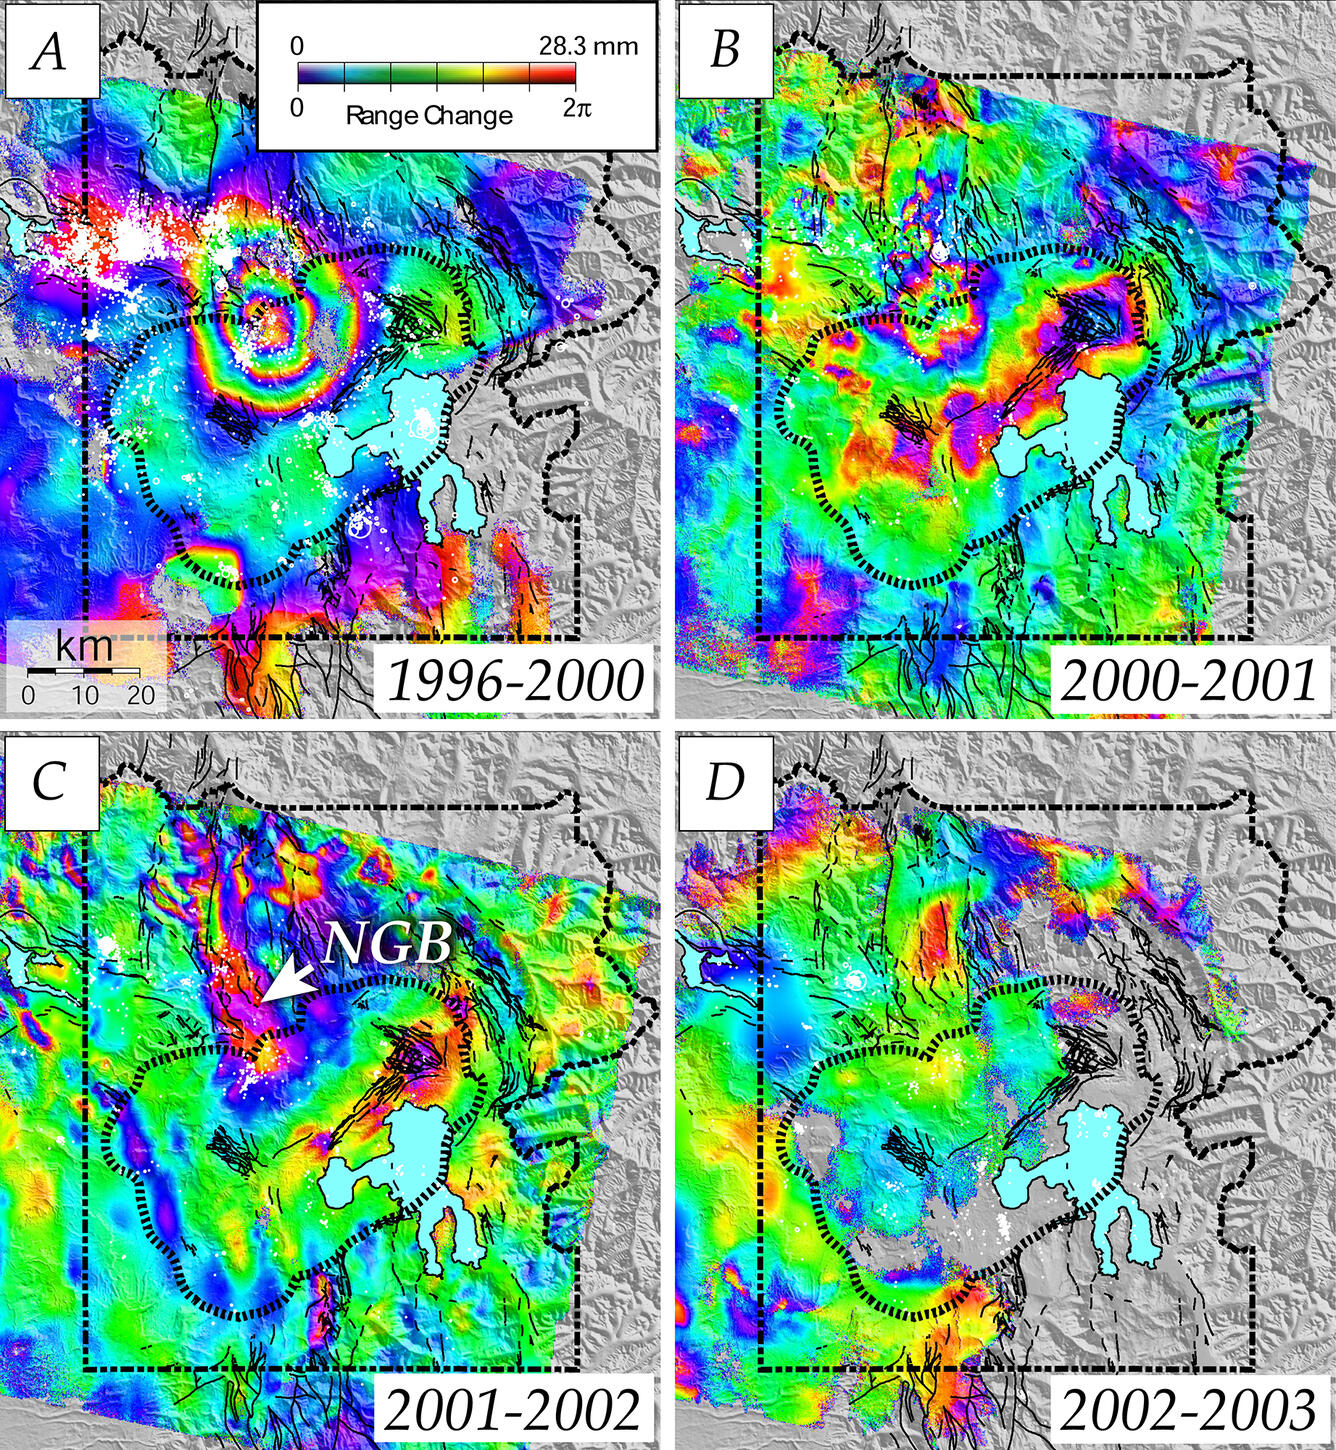
Four radar interferograms (InSAR data) superimposed on digital terrain showing surface movement at Norris Geyser Basin and Yellowstone Caldera from 1996 to 2003. A color change from violet to blue to green to yellow to red, shown in the color bar in A, marks an increase in the distance from the satellite to points on the ground (mostly subsidence) of 28.3 mm (1.1 inch), and vice versa. White dots represent epicenters of earthquakes recorded during the time interval spanned by each interferogram. Black parallel dashes outline caldera rim. A, 1996–2000. Concentric color bands along the north caldera rim indicate surface uplift by as much as 8 cm (3.1 in) centered near Norris Geyser Basin. B, 2000–2001. Uplift near Norris and subsidence of the caldera floor continued at a lower rate. C, 2001–2002. Uplift near Norris and subsidence of the caldera floor continued to slow during this period. Arrow labeled NGB marks the location of Norris Geyser Basin. D, 2002–2003. Norris uplift and caldera floor subsidence had nearly stopped by 2003, but a second episode of Norris uplift started in mid-2013 (not shown).
Sources/Usage
Public Domain.
Related
Uplift along the north rim of Yellowstone Caldera
Related