
Gas math—how we know how much sulfur dioxide volcanoes emit
By Kīlauea

Detailed Description
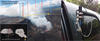
The left diagram shows how incoming UV would get absorbed by the SO2 plume (faded red arrows) along a spectrometer traverse under the plume (yellow arrow). Under clear sky, no UV is absorbed (blue arrows). Inset is a cartoon diagram of a plume ‘slice’ that the spectrometer measures. At right is the telescope of the UV spectrometer mounted to an HVO vehicle during the 2018 lower East Rift Zone eruption. The telescope is aimed up at the sky, and a fiber optic cable (taped to car window) connects the bottom of the telescope to the spectrometer inside the car. Also visible is a wire attached to a GPS antenna on top of the car. USGS images.
Sources/Usage
Public Domain.