
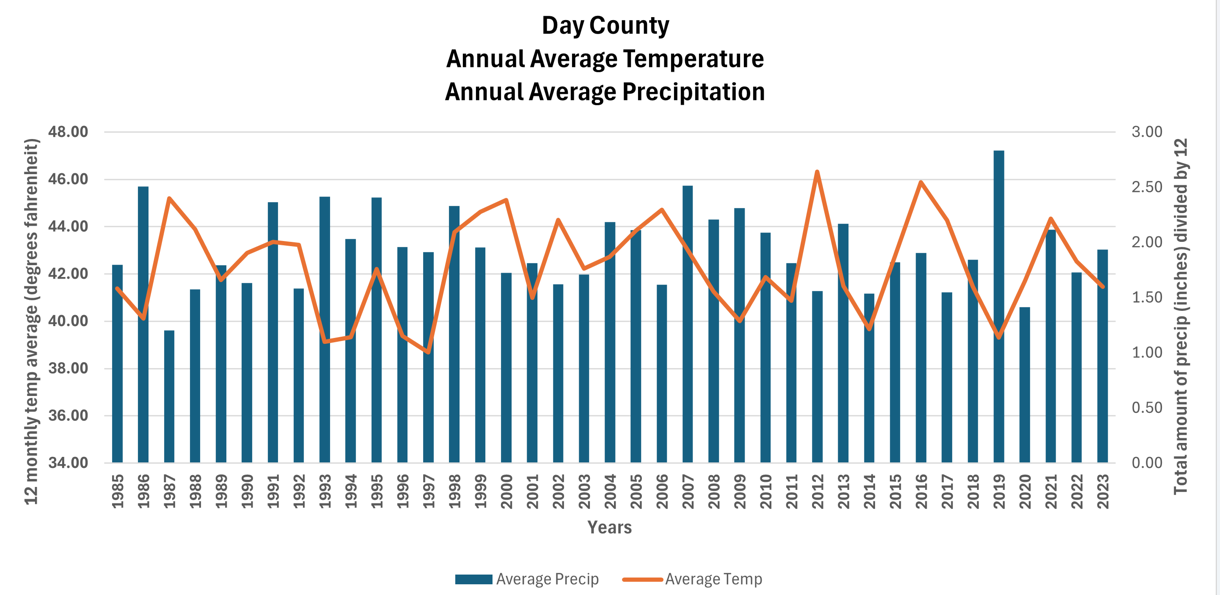
Graph of Day County, SD, Annual Average Temperature and Annual Average Precipitation

Detailed Description
A graph showing Day County, South Dakota, Annual Average Temperature and Annual Average Precipitation for 1985 to 2023. Precipitation is shown in the bars, and temperature is shown on the orange line. Both were obtained from the National Oceanic and Atmospheric Administration.
Sources/Usage
Public Domain.