
Graph of land cover data

Detailed Description
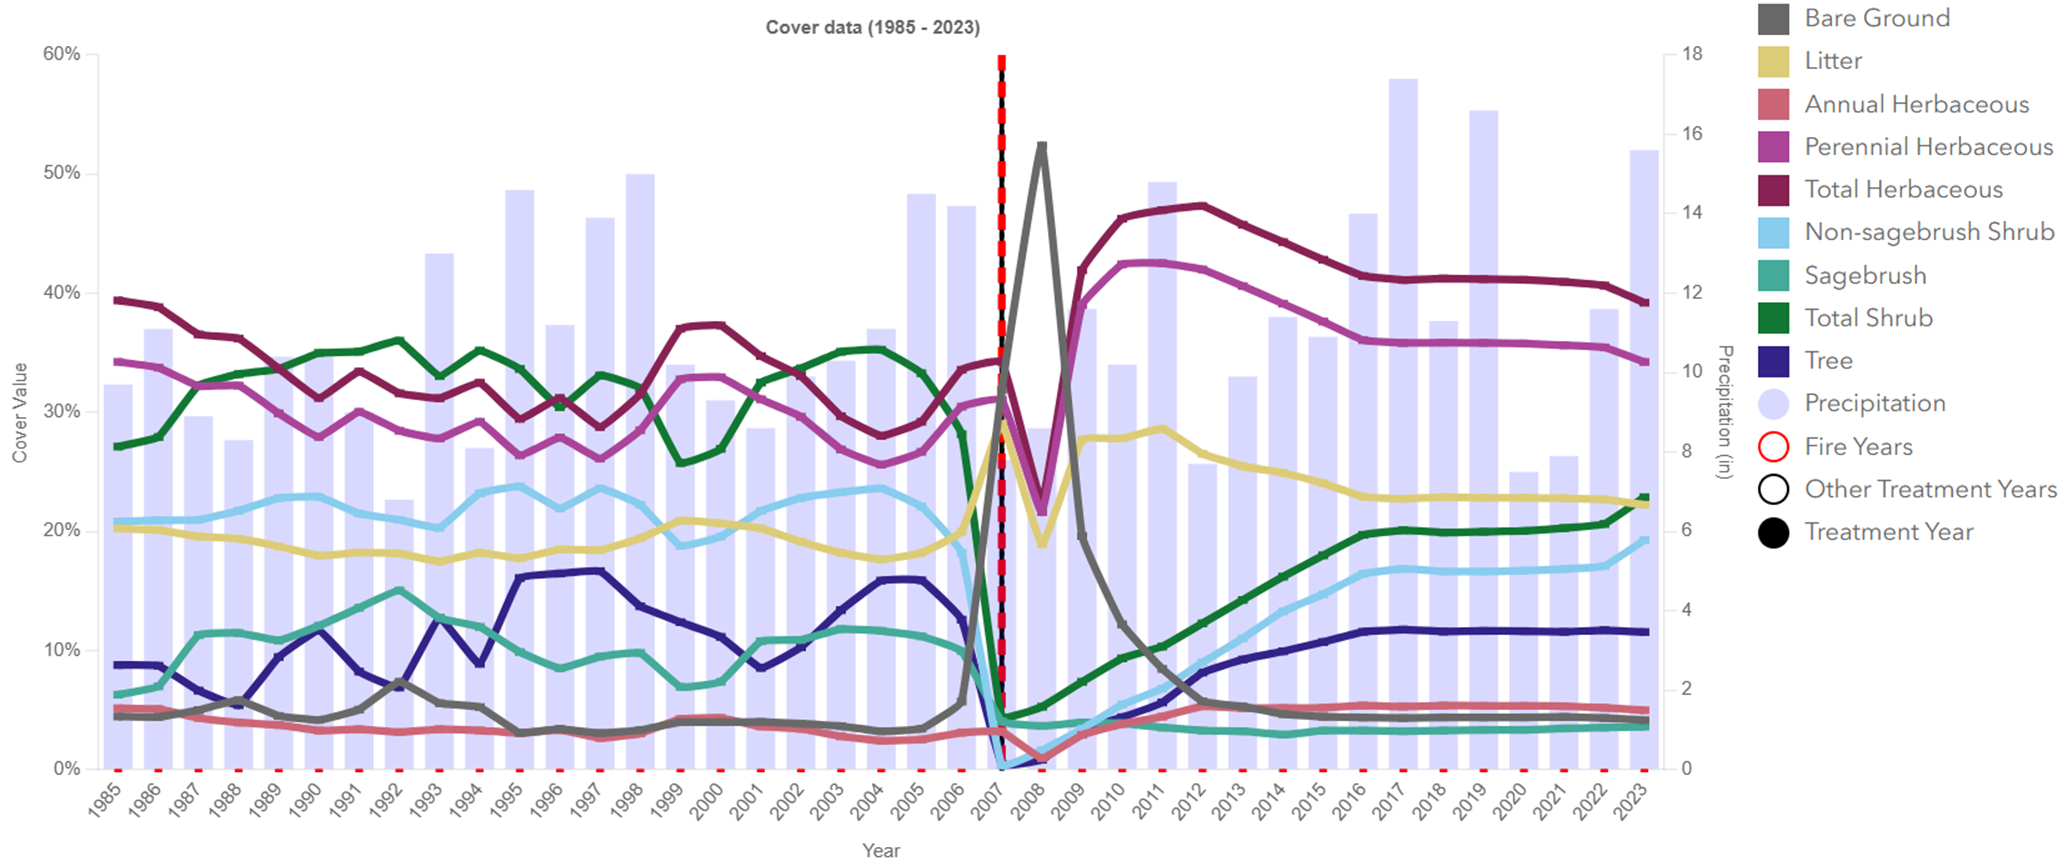
This chart displays annual land cover and rainfall specifically for LTDL treatment polygon areas. Information from these charts can help resource managers understand the long-term vegetation trends from past treatments, alongside the context of annual precipitation and other fire and treatment disturbances. This example is from a post-wildfire treatment. The fire and treatment occurred in 2007, which is delineated with a dashed red line for years of fire and a black line for the year of treatment. Before the fire, the area was dominated by shrubs (totaling ~30%), which plummeted to near zero immediately after the fire event. In the wake of the fire, bare ground briefly spiked to over 50% before being replaced by a surge in herbaceous plant cover, which remained the dominant cover (near 40%). While total shrub cover has steadily recovered to about 22%, it remains below pre-fire levels, and precipitation (shown as background bars) continues to fluctuate annually, influencing these recovery trends.
Sources/Usage
Public Domain.