
Land Treatment Digital Library Version 2.0 Launch
The U.S. Geological Survey launched an updated version (2.0) of the Land Treatment Digital Library to improve user experience, include additional data, and enhance Bureau of Land Management access.
The U.S. Geological Survey partners with the Bureau of Land Management (BLM) to create and maintain the Land Treatment Digital Library (LTDL) data and website. The LTDL is an online catalog of legacy land treatment information carried out on BLM lands in the western United States. The LTDL compiles many different types of land treatments, such as seedings, vegetation removals, and prescribed fire - and is used by land managers to help them make decisions about where, when, and how to implement future land treatments using the Land Treatment Exploration Tool. The LTDL houses information on over 70,000 treatments across the western United States.
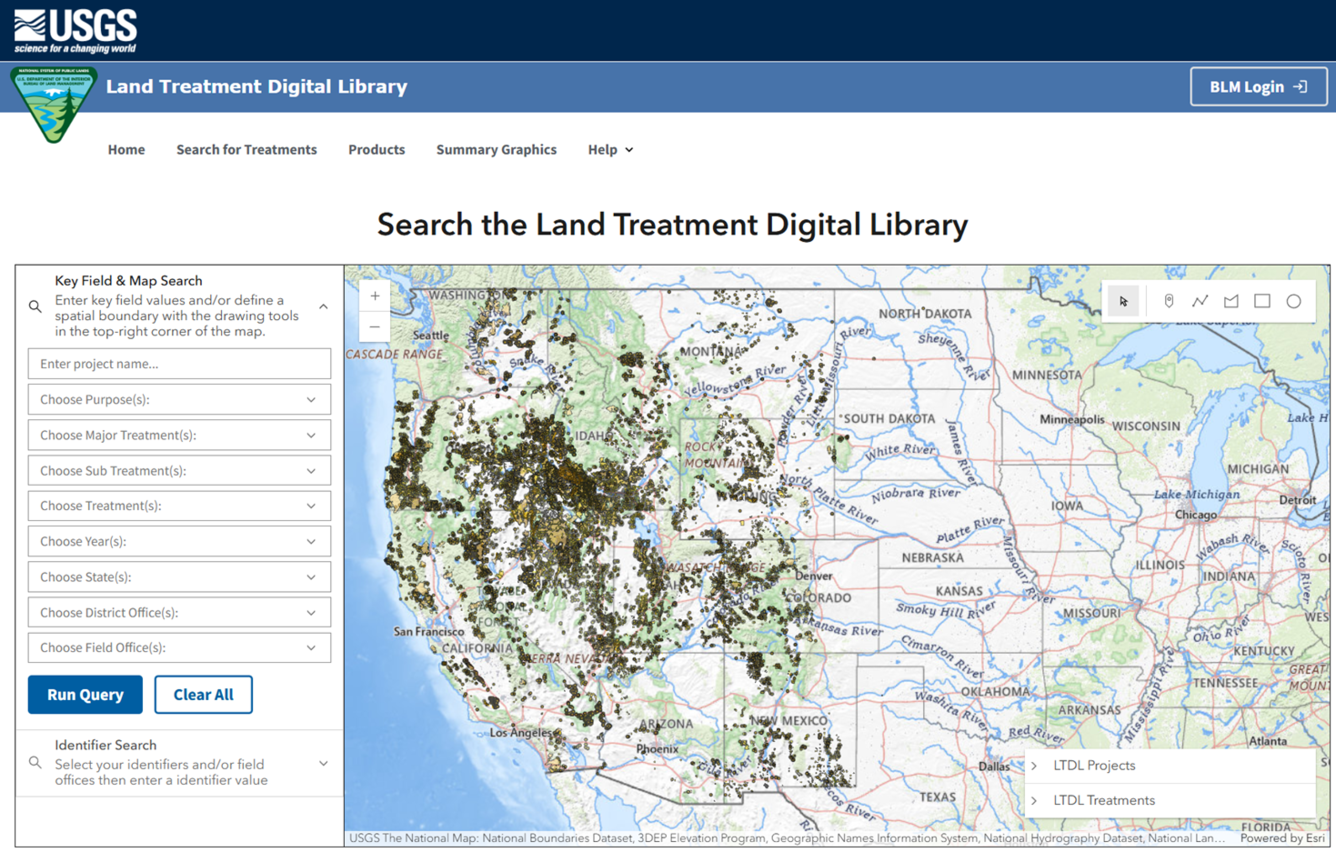
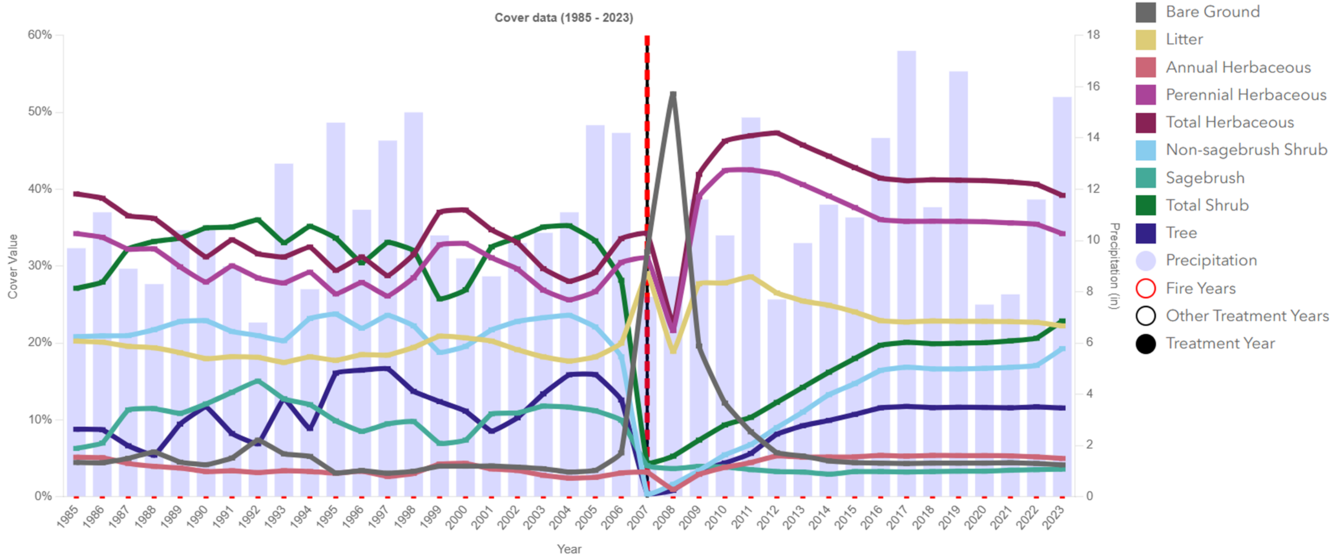
The U.S. Geological Survey launched an updated version (2.0) of the LTDL to improve user experience, include additional data, and enhance BLM access. Notable additions to the website include interactive figures for each treatment polygon that display the monthly average temperature and precipitation from PRISM Climate Group at Oregon State University, and the annual vegetation cover from Multi-Resolution Land Characteristics Consortium.
Since its original launch in 2009, the LTDL has become an important tool for resource managers to learn from restoration actions and the data are used for restoration planning through the Land Treatment Exploration Tool. Over 80 publications have utilized the LTDL to help address resource management questions and further the understanding of restoration science, which leads to more efficient and durable treatments. Visit the LTDL to learn more.
Remotely Sensed Vegetation Cover Data for Treatment Polygons
Related
Wildlife Ecology and Habitat Restoration Team
Related