
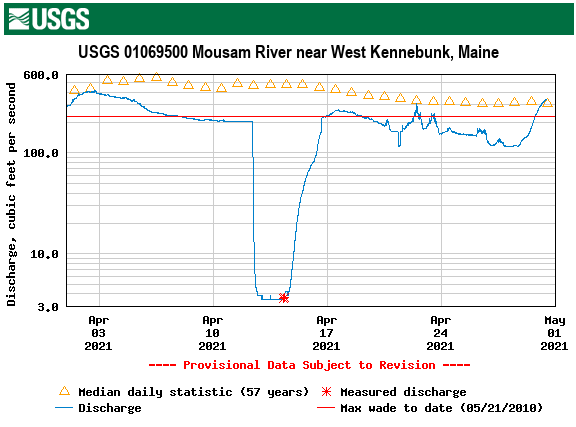
Graph shows unit value discharge from USGS station 01069500

Detailed Description
The graph shows unit value discharge from USGS station 01069500 for the month of April 2021. The blue line represents the current values, while historical daily medians are represented by yellow triangles. Red asterisks designate measurements of discharge by USGS staff.
Sources/Usage
Public Domain.