
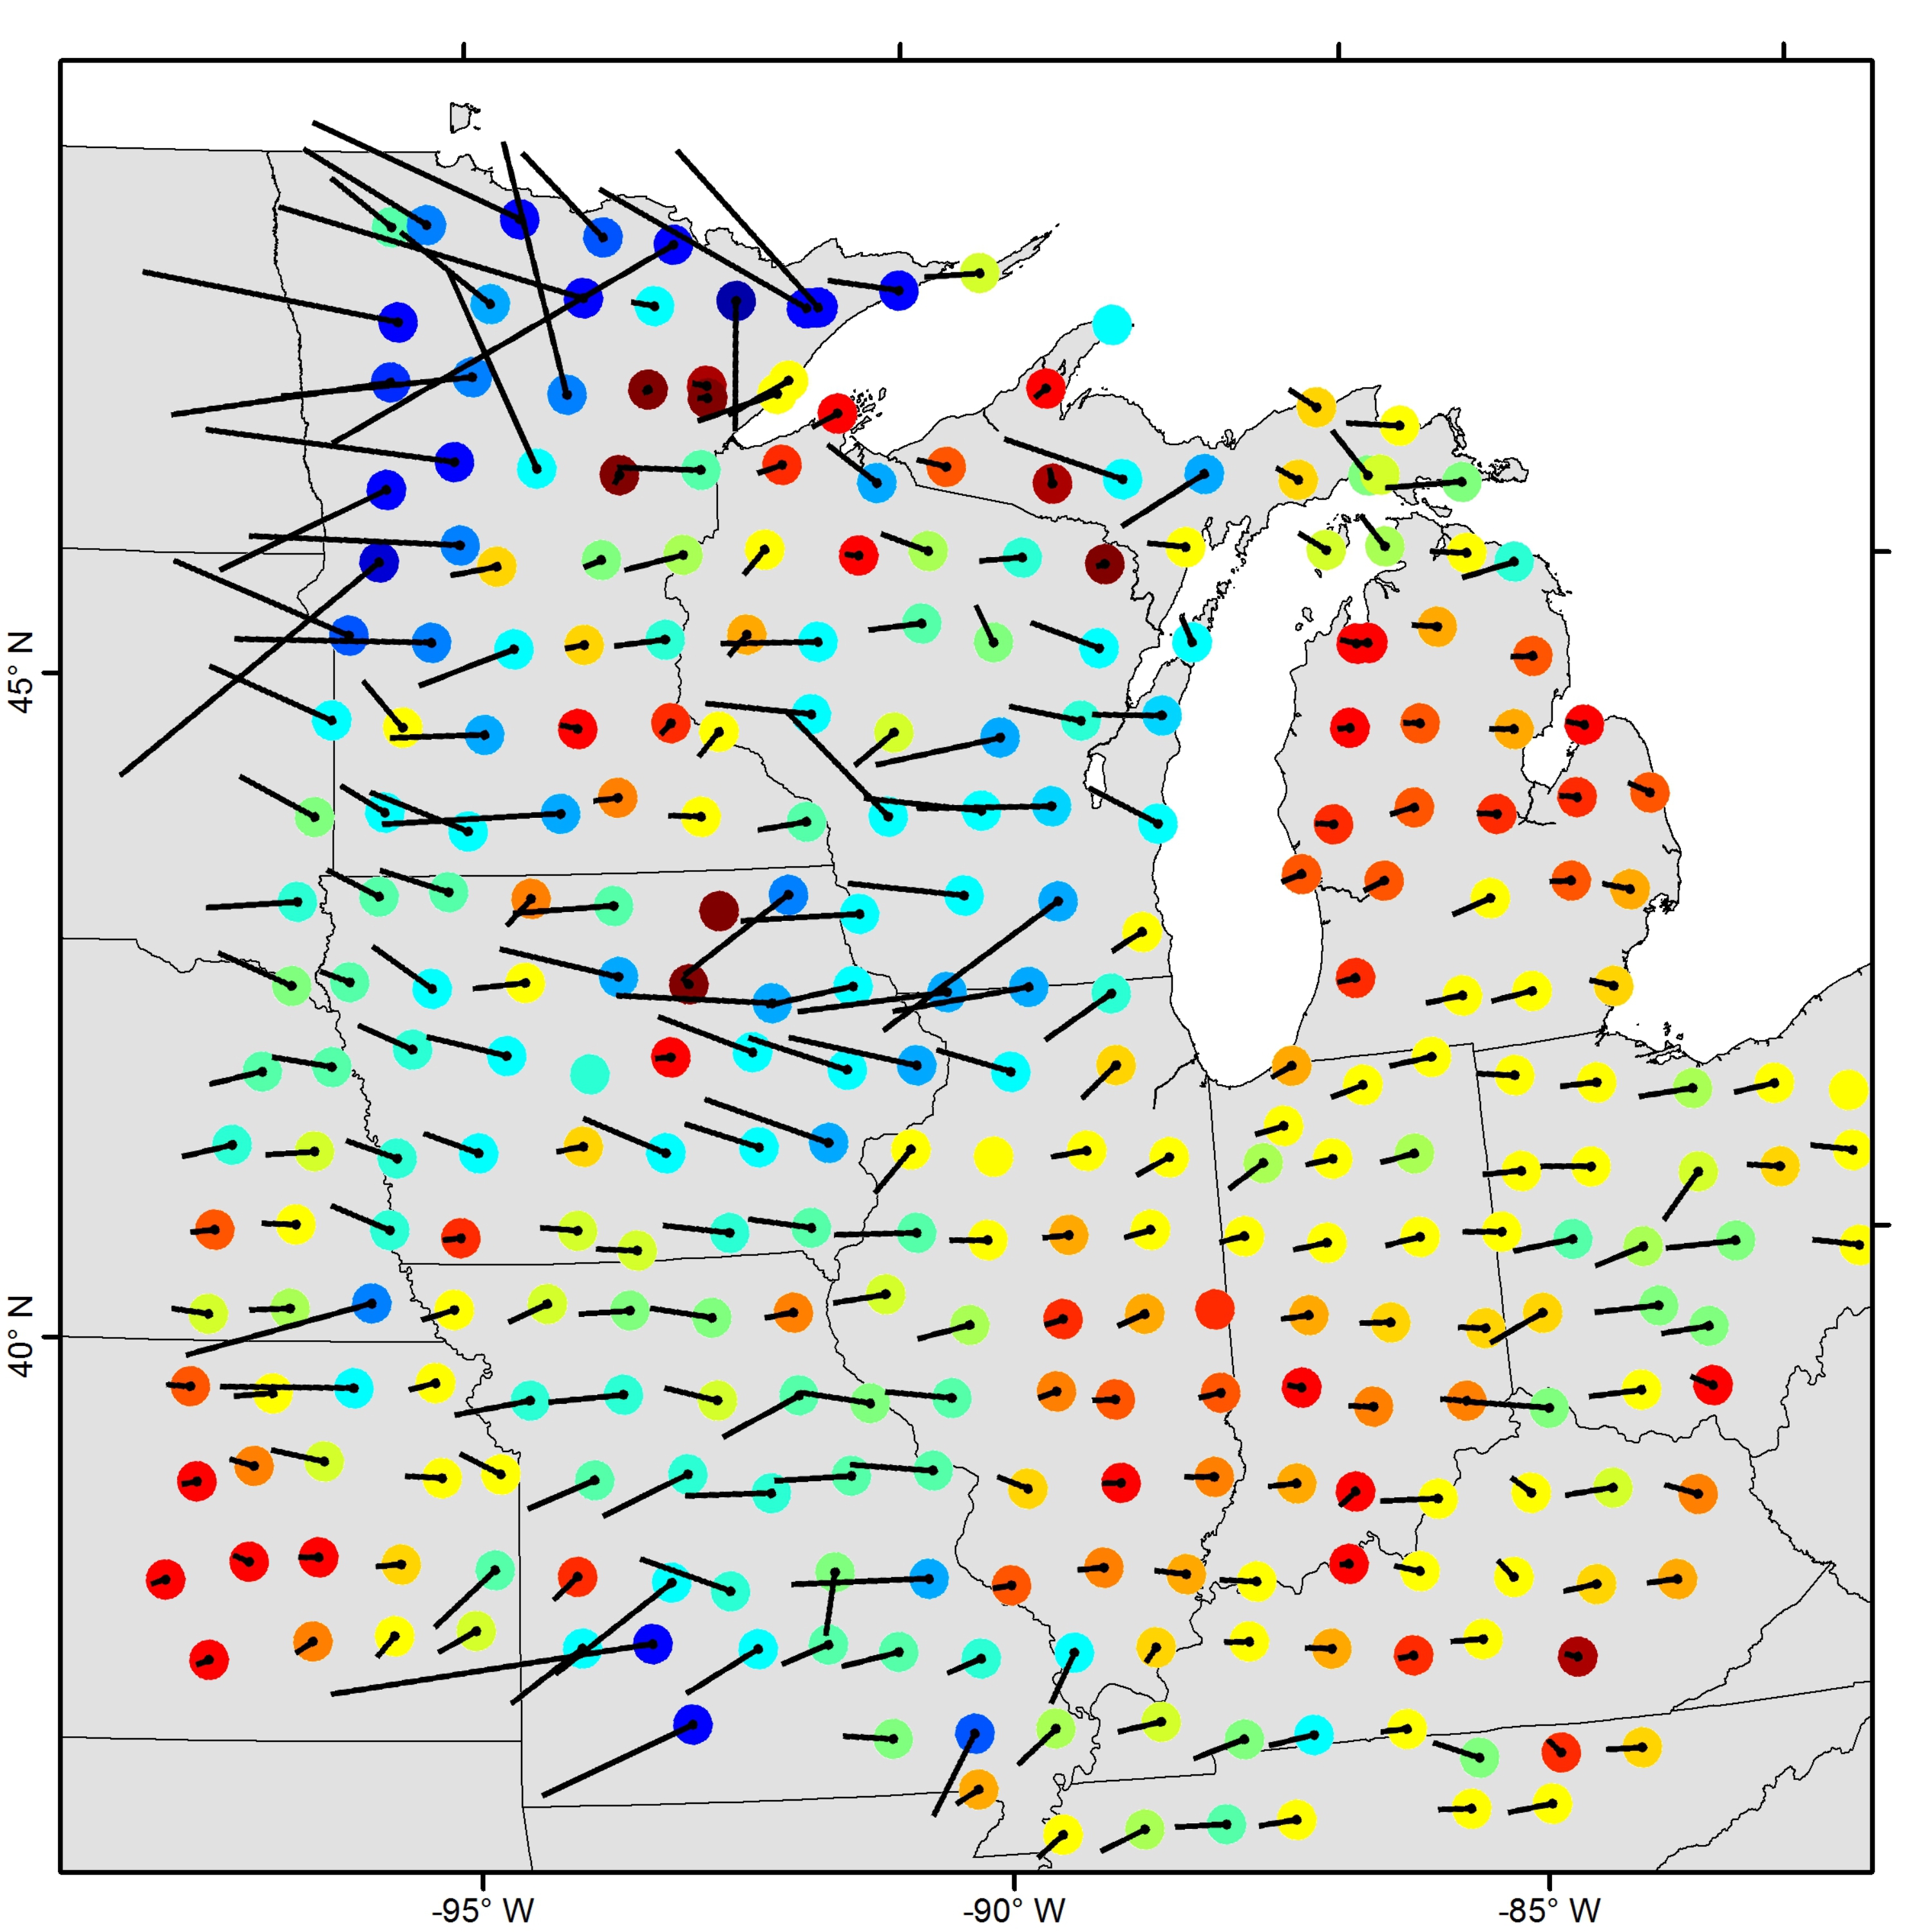
Graphic showing how the geoelectric vectors (black) can vary with location during a magnetic storm.

Detailed Description
Graphic showing how the geoelectric vectors (black) can vary with location during a magnetic storm. Locations with cool colors (blue and green) and long lines represent relatively higher hazards for impacts on Earth’s surface from a magnetic storm. Locations with warm colors (red and orange) and short vectors represent relatively lower hazards for impacts from a magnetic storm, while long vectors represent higher hazard. Credit: Paul Bedrosian, USGS.