
Great Lakes Basin River Water-Quality Trends
Detailed Description
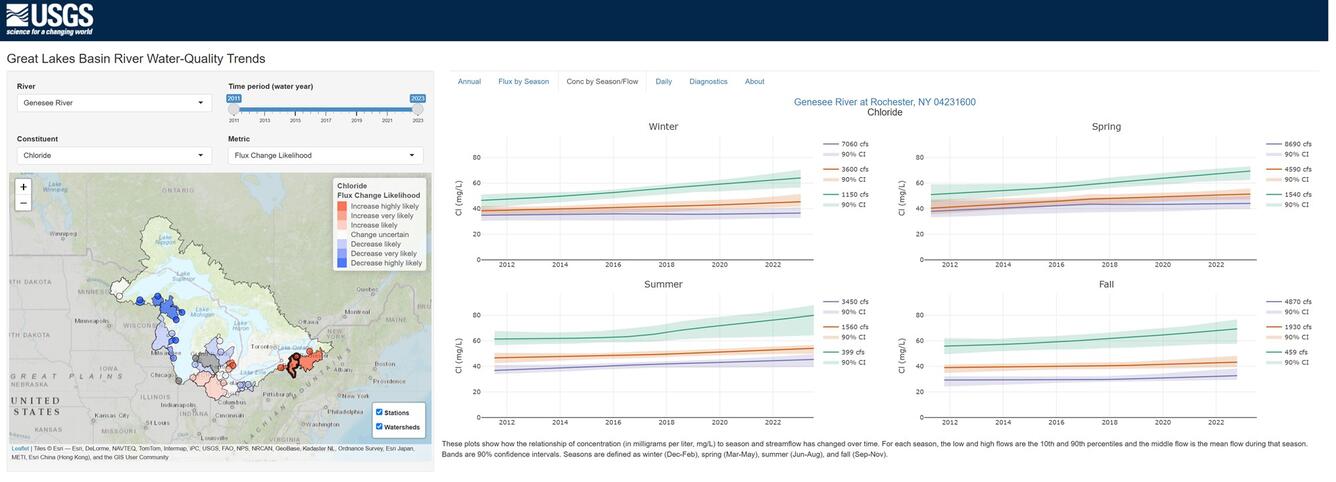
Great Lakes Basin River Water-Quality Trends infographic from GLRI Trends.
These plots show how the relationship of concentration (in milligrams per liter, mg/L) to season and streamflow has changed over time. For each season, the low and high flows are the 10th and 90th percentiles and the middle flow is the mean flow during that season. Bands are 90% confidence intervals. Seasons are defined as winter (Dec-Feb), spring (Mar-May), summer (Jun-Aug), and fall (Sep-Nov).
Sources/Usage
Public Domain.
Related
Investigating Links between Chloride and Harmful Algal Blooms in the Great Lakes
The USGS is investigating links between chloride concentrations in Great Lakes tributaries as a catalyst for Harmful Algal Blooms (HABs).
Related
Investigating Links between Chloride and Harmful Algal Blooms in the Great Lakes
The USGS is investigating links between chloride concentrations in Great Lakes tributaries as a catalyst for Harmful Algal Blooms (HABs).