
How an area changes through time with a well pad

Detailed Description
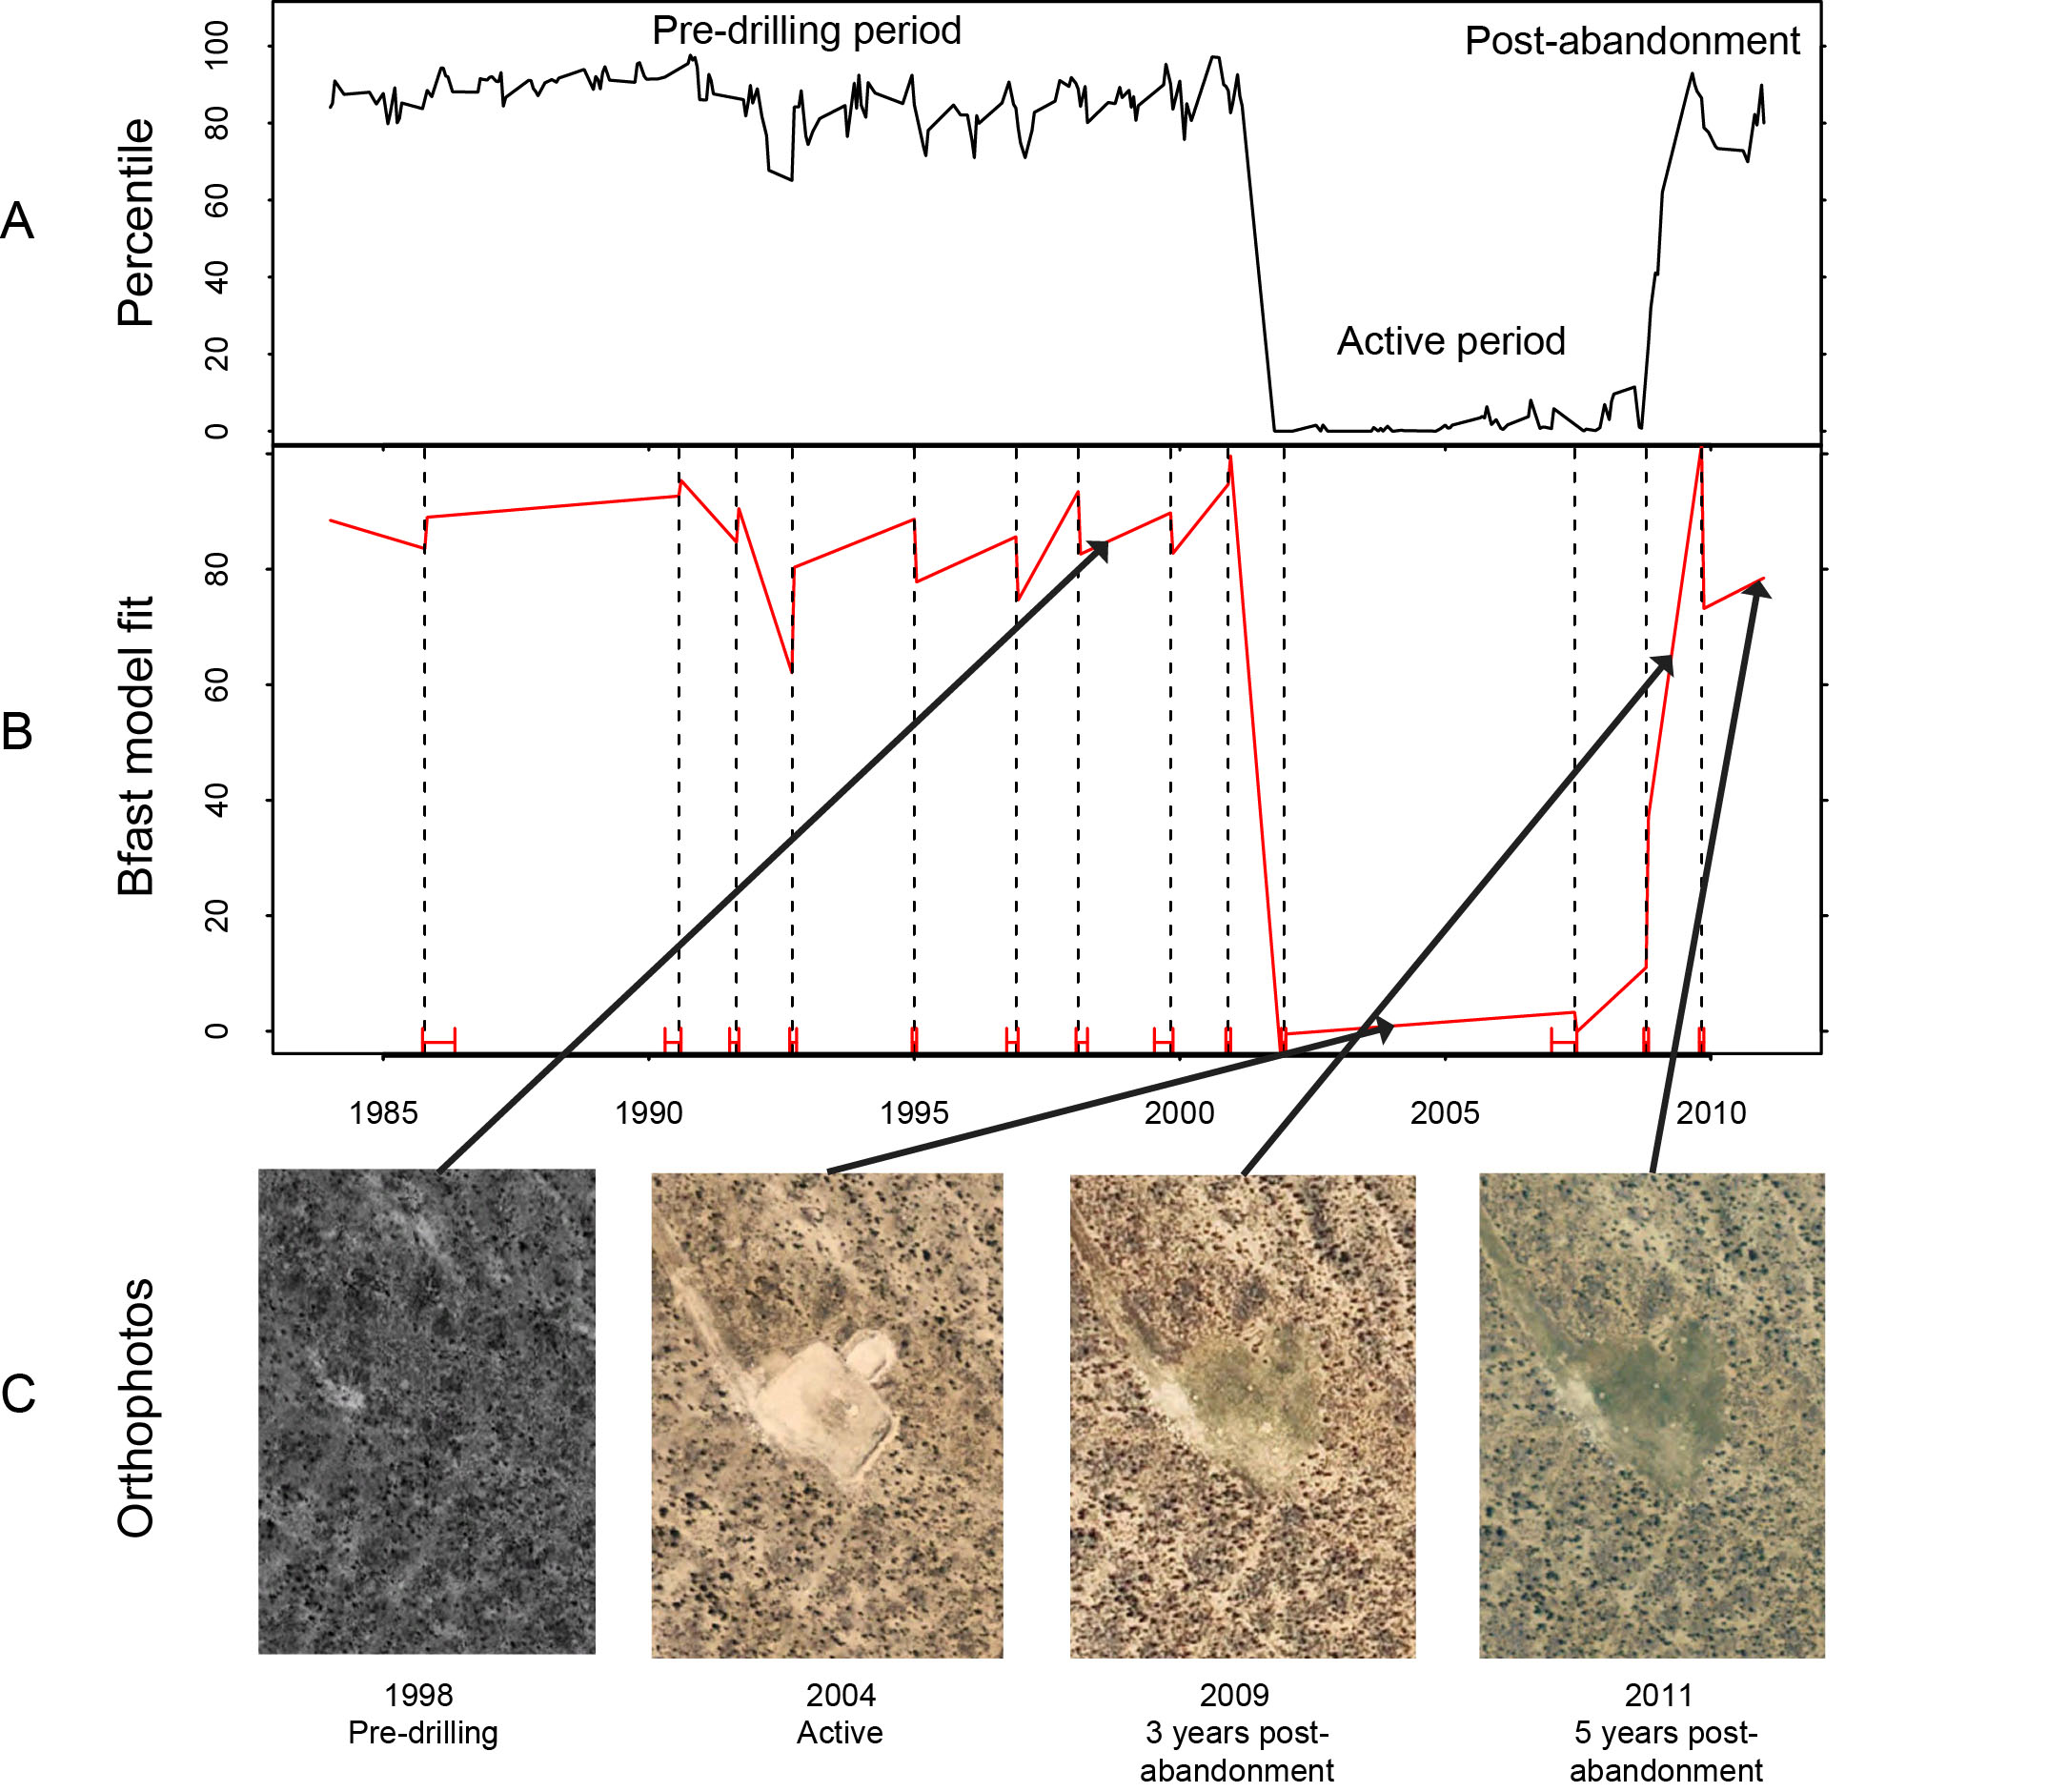
Graph showing A) Landsat time series of the Soil-Adjusted Total Vegetation Index (SATVI) from 1984-2011. Phases include pre-drilling from 1984-2002, active from 2002-2006, and post-abandonment 2006-2011, B) Bfast model of trends used to estimate breaks in the time series, and C) orhtophotos showing the site during different points in time and where those dates fall on the Landsat time series. The rapid cover change from 2006-2009 and the appearance of dense green.
Sources/Usage
Public Domain.
Related

Remote Sensing of Energy Development
Oil and gas development across the western United States has increased substantially in recent decades, including within the Colorado Plateau. The Colorado Plateau is a high desert region of grasslands, shrublands, and woodlands and is home to a large number of world-renowned national and tribal parks and monuments (e.g., Grand Canyon, Zion, Bryce, Arches, Canyonlands, Monument Valley, and Mesa...
Related
Remote Sensing of Energy Development
Oil and gas development across the western United States has increased substantially in recent decades, including within the Colorado Plateau. The Colorado Plateau is a high desert region of grasslands, shrublands, and woodlands and is home to a large number of world-renowned national and tribal parks and monuments (e.g., Grand Canyon, Zion, Bryce, Arches, Canyonlands, Monument Valley, and Mesa...