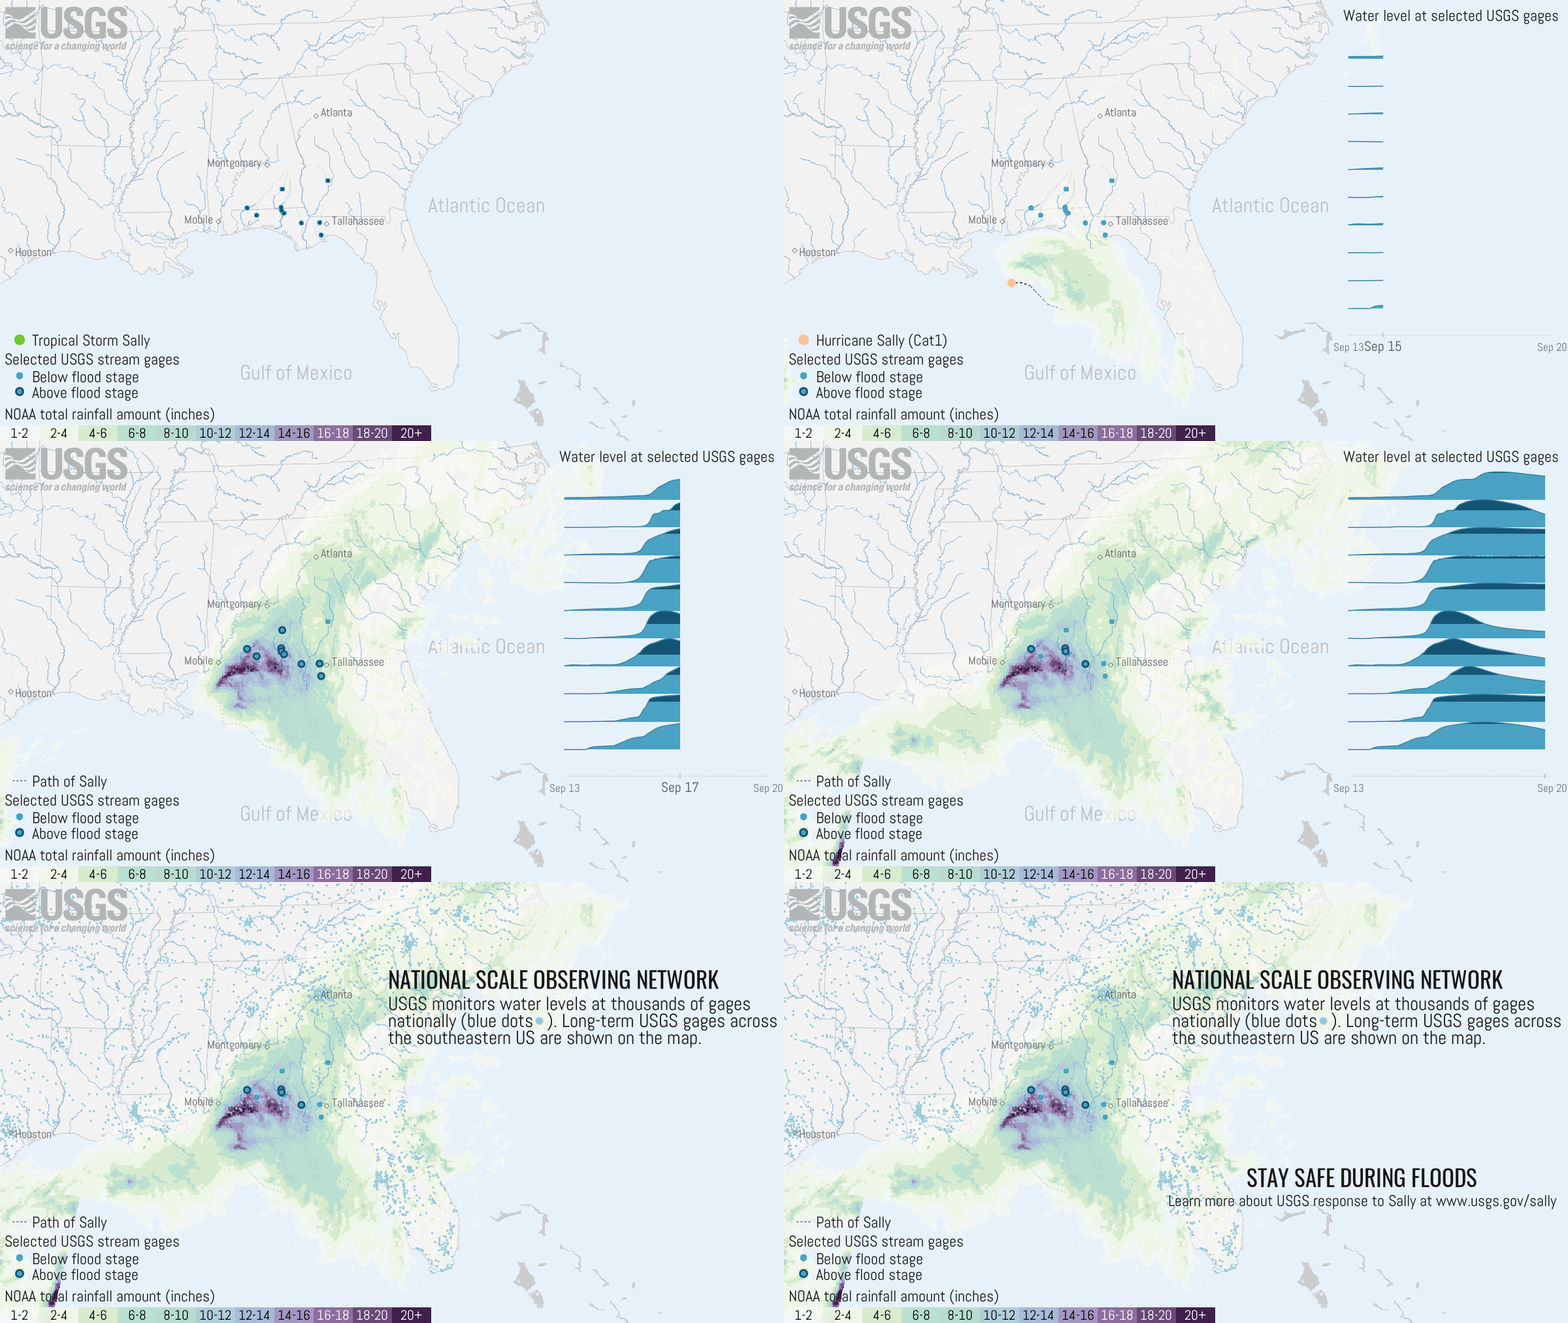
Hurricane Sally Water Footprint Data Visualization

Detailed Description
Watch Hurricane Sally move through the southeast U.S. in this data visualization, and see USGS streamgage measurements spike as the storm’s extreme rainfall leads to intense flooding. USGS streamgages provide critical information during storms to flood forecasters and emergency managers as they make decisions that contributes to protecting lives and property. Understanding river levels and locations of flooding can make a huge difference in these dangerous storms. The water footprint visualization shows patterns of precipitation and river discharge of 10 USGS streamgages greatly impacted by Hurricane Sally.
Learn more about the USGS response to Hurricane Sally.
Sources/Usage
Public Domain.

