
Hypothetical Riverine, Boat, Acoustic Doppler Current Profiler, and Graphs Diagram
Detailed Description
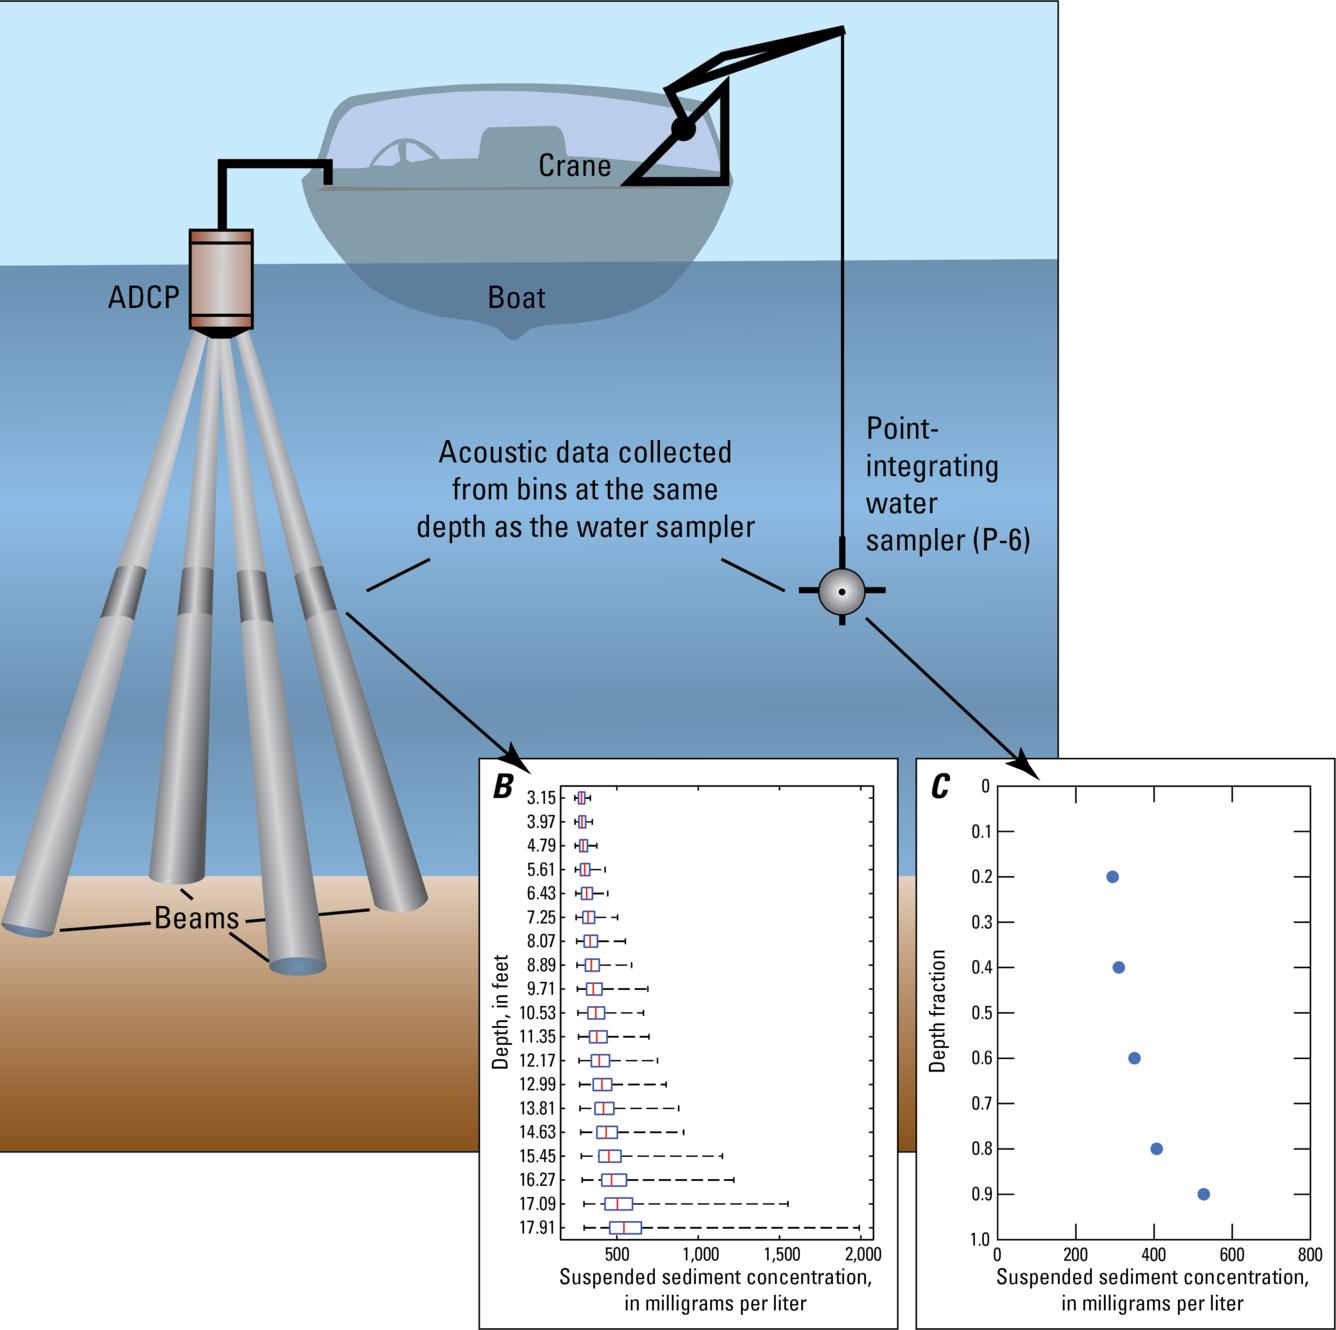
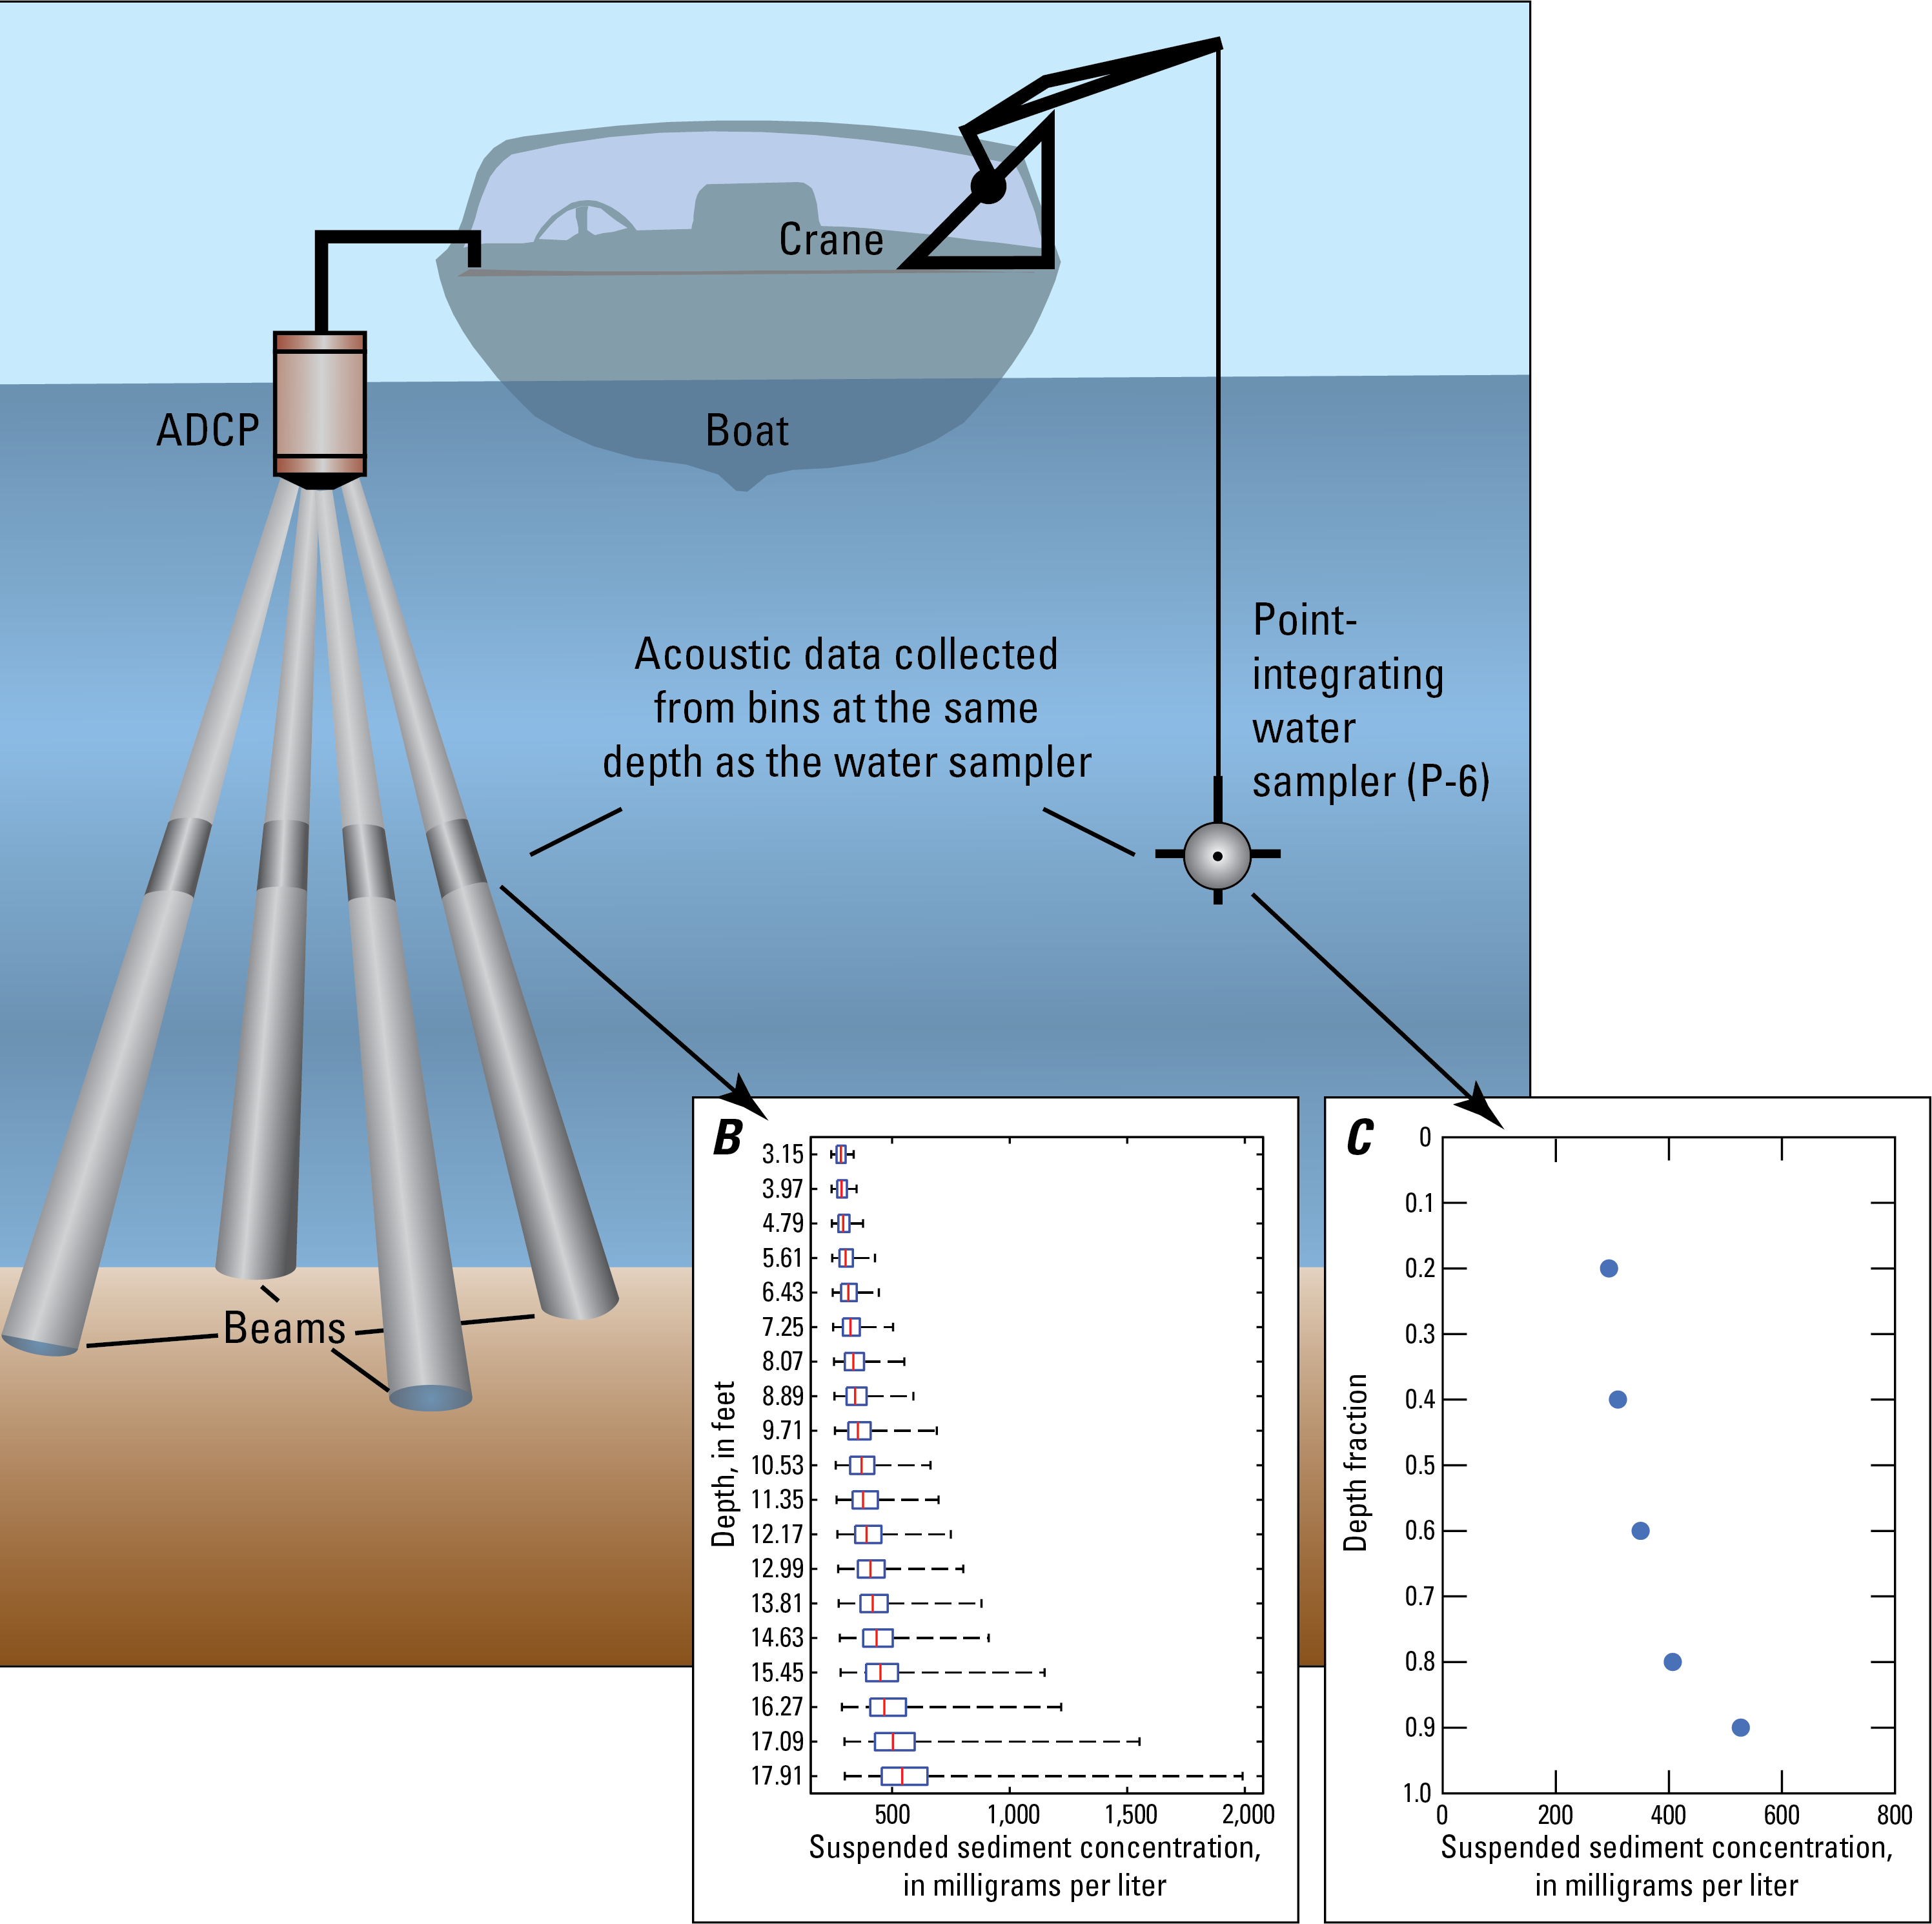
This illustration shows a boat in the top middle and the viewer is looking at the front of the boat. There is a crane on the port side of the boat, and a cable extending from the crane and into the water. A suspended-sediment sampler is attached to the cable and is in the middle of the water column. On the starboard side of the boat, there is an acoustic Doppler current profiler (ADCP) attached to the boat and is mostly in the water and there are four beams gong from the ADCP to the river’s bottom. There are two graphs on the bottom right side of the illustration. The left graph (B) shows box plots of suspended-sediment concentration (SSC) results on the x-axis from the calibrated ADCP data collected over 30 minutes versus depth on the y-axis. The right (C) graph shows SSC results on the x-axis from the physical point samples versus depth fraction on the y-axis.
Sources/Usage
Public Domain.