
Image of area around flow front
Detailed Description
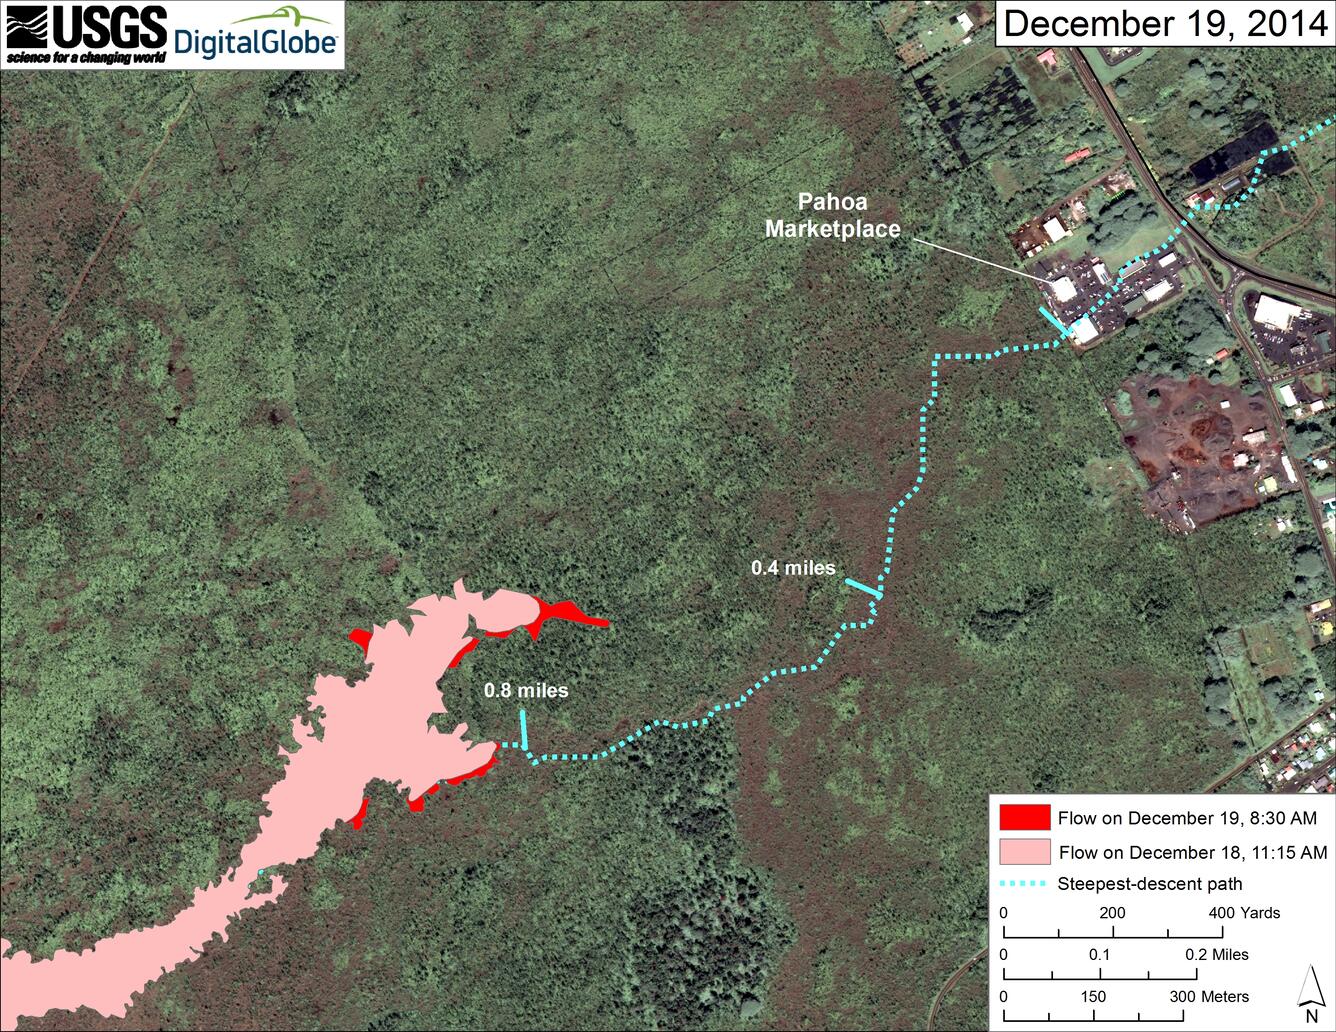
This map uses a satellite image acquired in March 2014 (provided by Digital Globe) as a base to show the area around the front of Kīlauea's active East Rift Zone lava flow. The area of the flow on December 18 at 11:15 AM is shown in pink, while widening and advancement of the flow as mapped on December 19 at 8:30 AM is shown in red
Advancement of the flow continued at a slower rate, compared to earlier in the week, and the flow moved about 120 meters (130 yards) since yesterday's mapping. A southern branch of the flow on this map, following the main steepest-descent path, was stalled when mapped this morning. The more northerly advancing branch was 0.9 km (0.6 miles) away from the back of the Pahoa Marketplace, measured in a straight line. Tick marks show distance above Pahoa Marketplace measured along the main steepest-descent path. The flow will probably reconnect with the steepest-descent path at around the 0.4-mile-mark, if it continues.
The blue line shows the dominant steepest-descent path for the drainage the lava flow is following, calculated from a 1983 digital elevation model (DEM; for calculation details, see http://pubs.usgs.gov/of/2007/1264/). Steepest-descent path analysis is based on the assumption that the DEM perfectly represents the earth's surface. DEMs, however, are not perfect, so the blue line on this map can be used to infer only an approximate flow paths.
Flow front