
InSAR data from the Yellowstone region spanning October 7, 2024 to October 2, 2025
Detailed Description
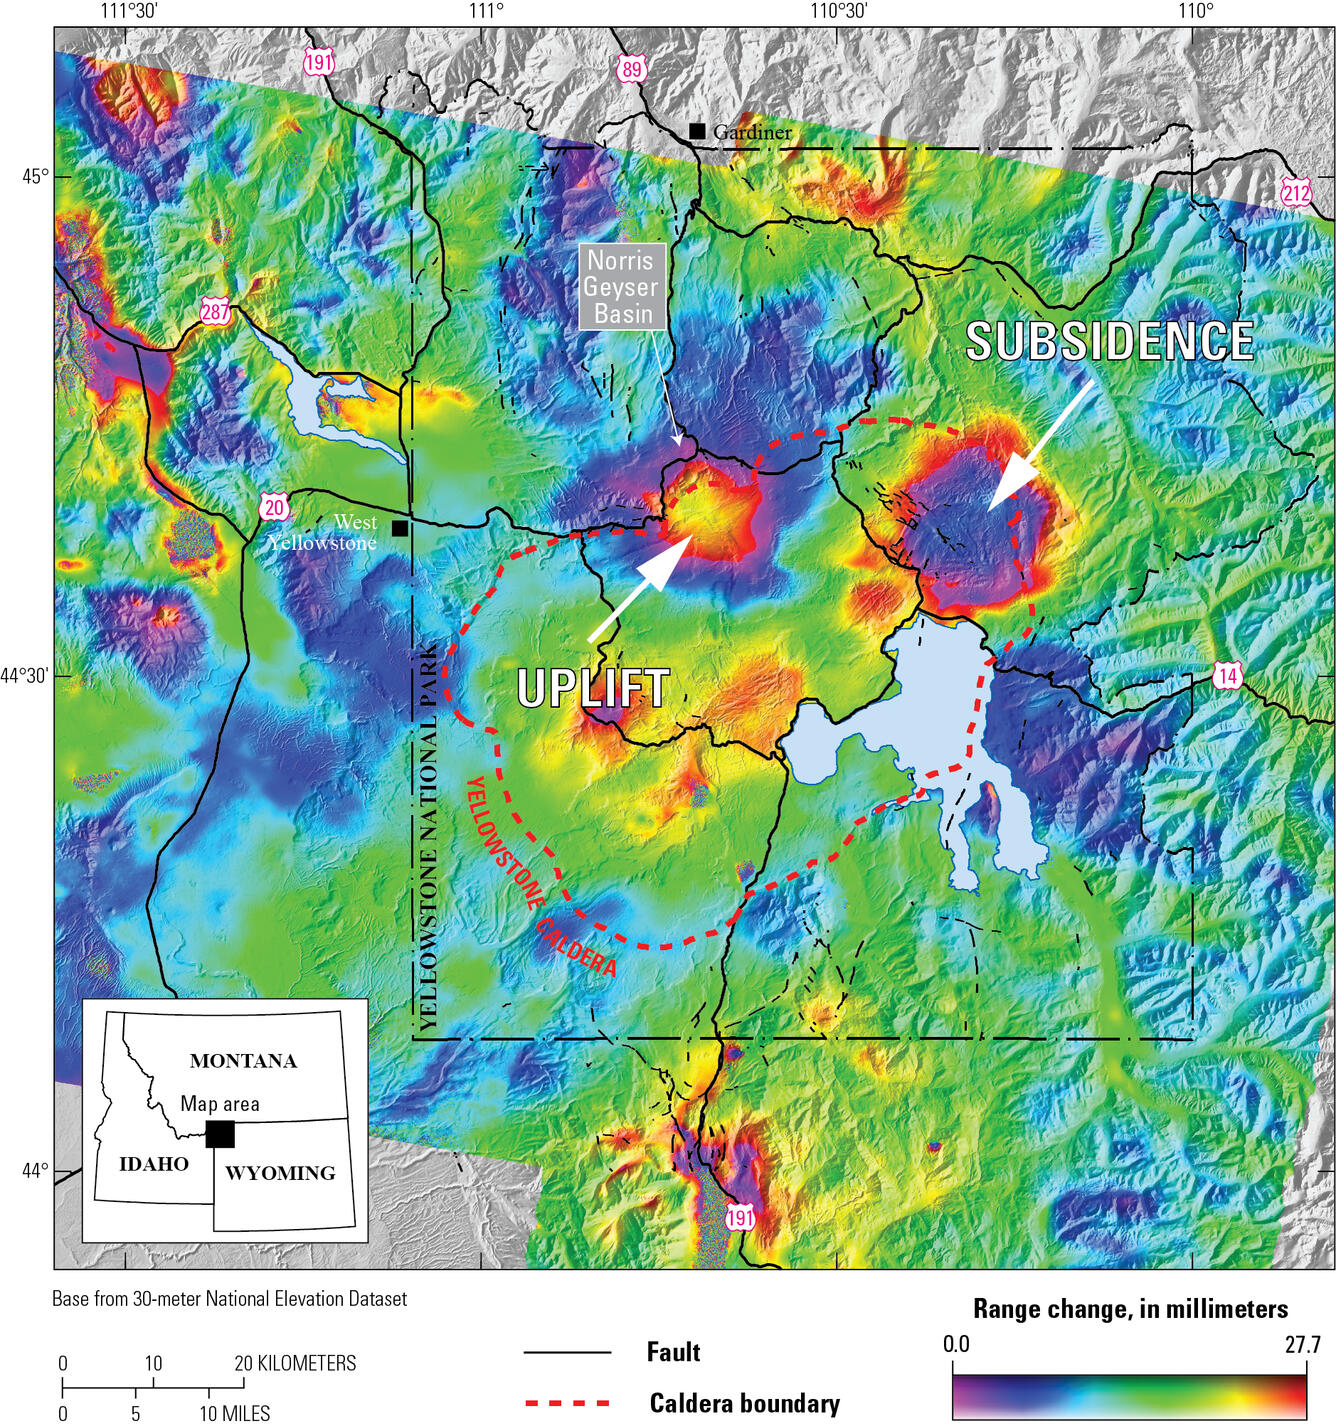
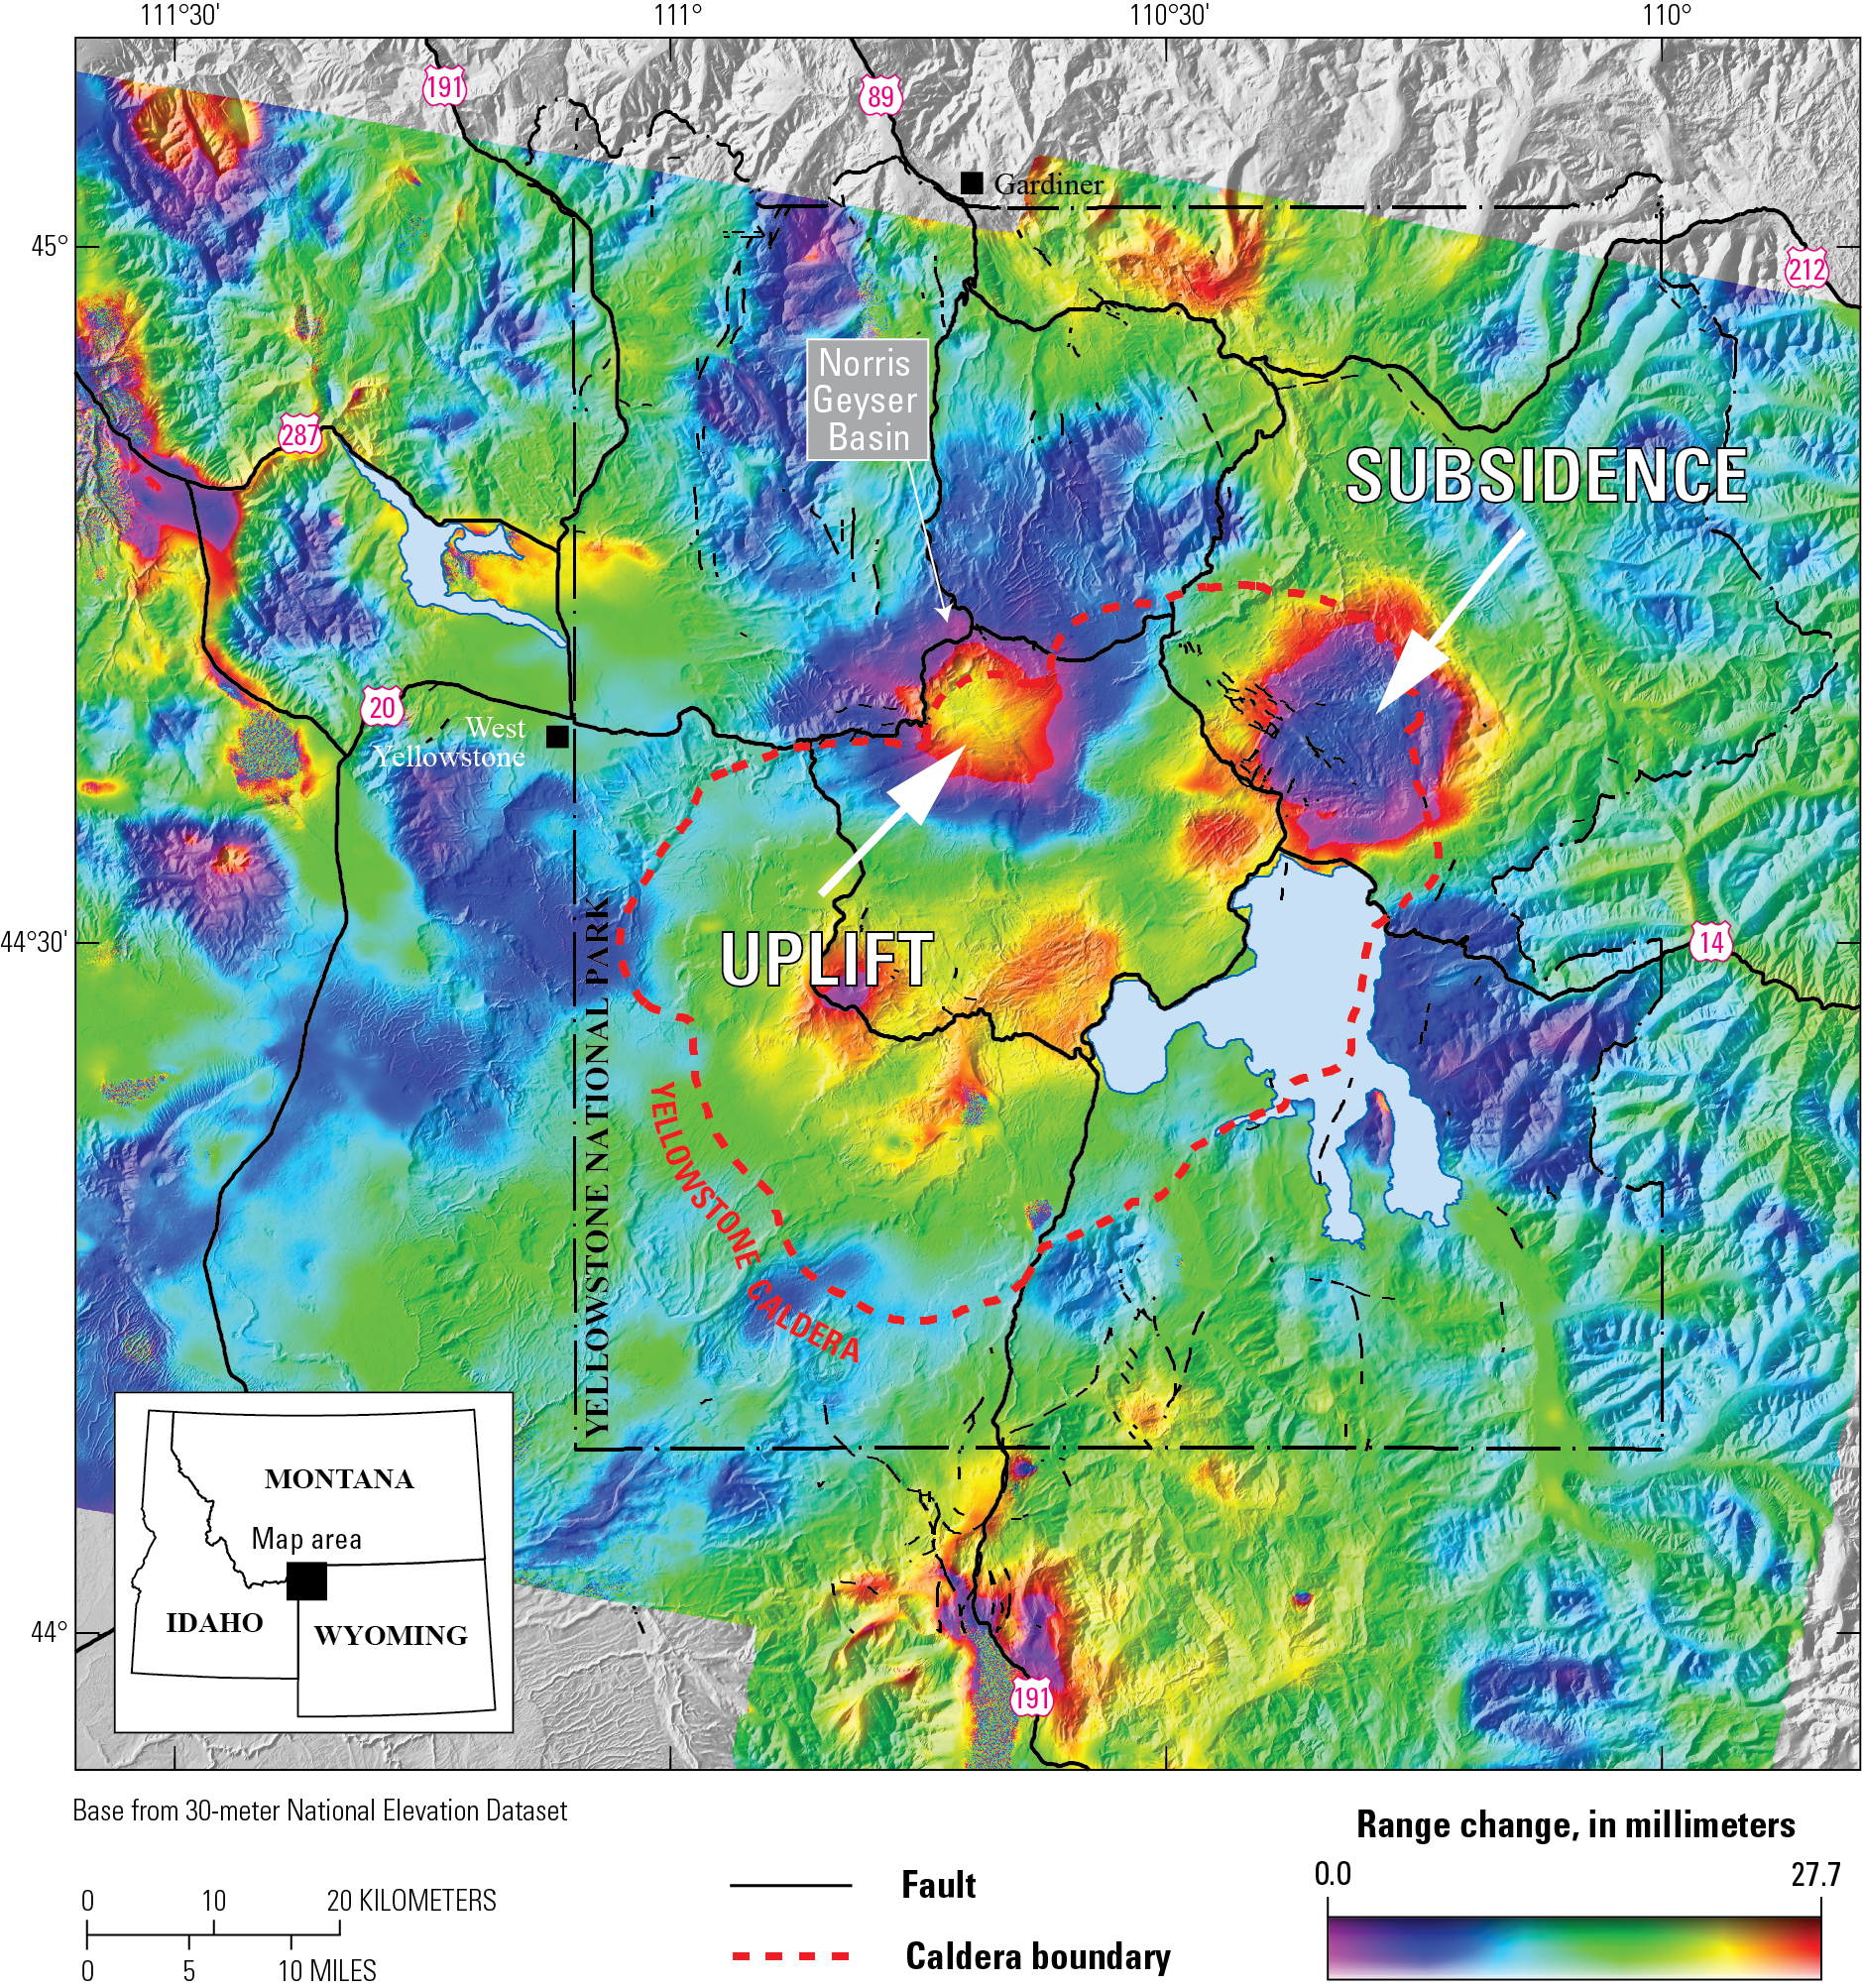
Interferogram created from satellite radar data collected on October 7, 2024, and October 2, 2025, over the Yellowstone region by the Sentinel-1 satellite system. Colored fringes indicate a change in distance (called range change) between the satellite and ground surface that is caused by surface deformation during the time spanned. In this interferogram, the fringes indicate subsidence (an increase in the range between the ground and the satellite) of about 2 centimeters (about 0.8 inches) in the east part of Yellowstone Caldera during the one-year period between the image acquisition times. In addition, about 2 centimeters (about 0.8 inches) of uplift occurred along the north caldera rim, just south of Norris Geyser Basin. Fringes outside the caldera are mostly related to atmospheric artifacts and do not reflect real ground motion. Black lines are roads, and red dashed line marks Yellowstone caldera.
Sources/Usage
Public Domain.
Related
Uplift along the north rim of Yellowstone Caldera
Related