
June 2022 Streamflow
Detailed Description
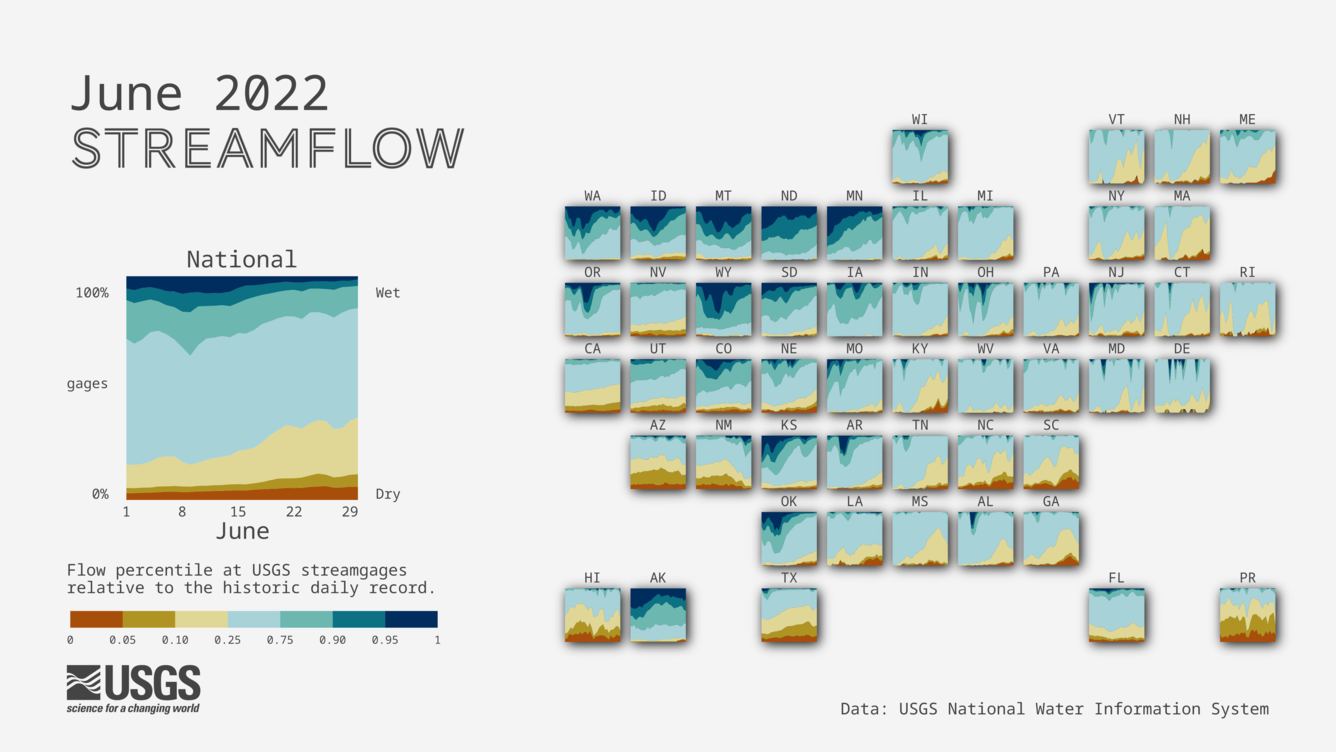
A cartogram map of the US with proportional area charts for each state showing the proportion of streamgages by flow levels, categorized using percentile bins. Streamflow level percentiles are calculated using the historic daily record for each gage, and binned to reflect whether flow conditions are wetter or drier than the historical record. For the month of June, many areas of the US had relatively dry conditions, including New England, the southeast, Puerto Rico, Hawaii, and the southwest. The northwestern US had fairly high streamflow reflecting flooding in areas such as Yellowstone.
View the previous month's streamflow conditions: May 2022 Streamflow | U.S. Geological Survey (usgs.gov)
Sources/Usage
Public Domain.