
June 27th lava flow and steepest descent paths near Pāhoa, Kīlauea
Detailed Description
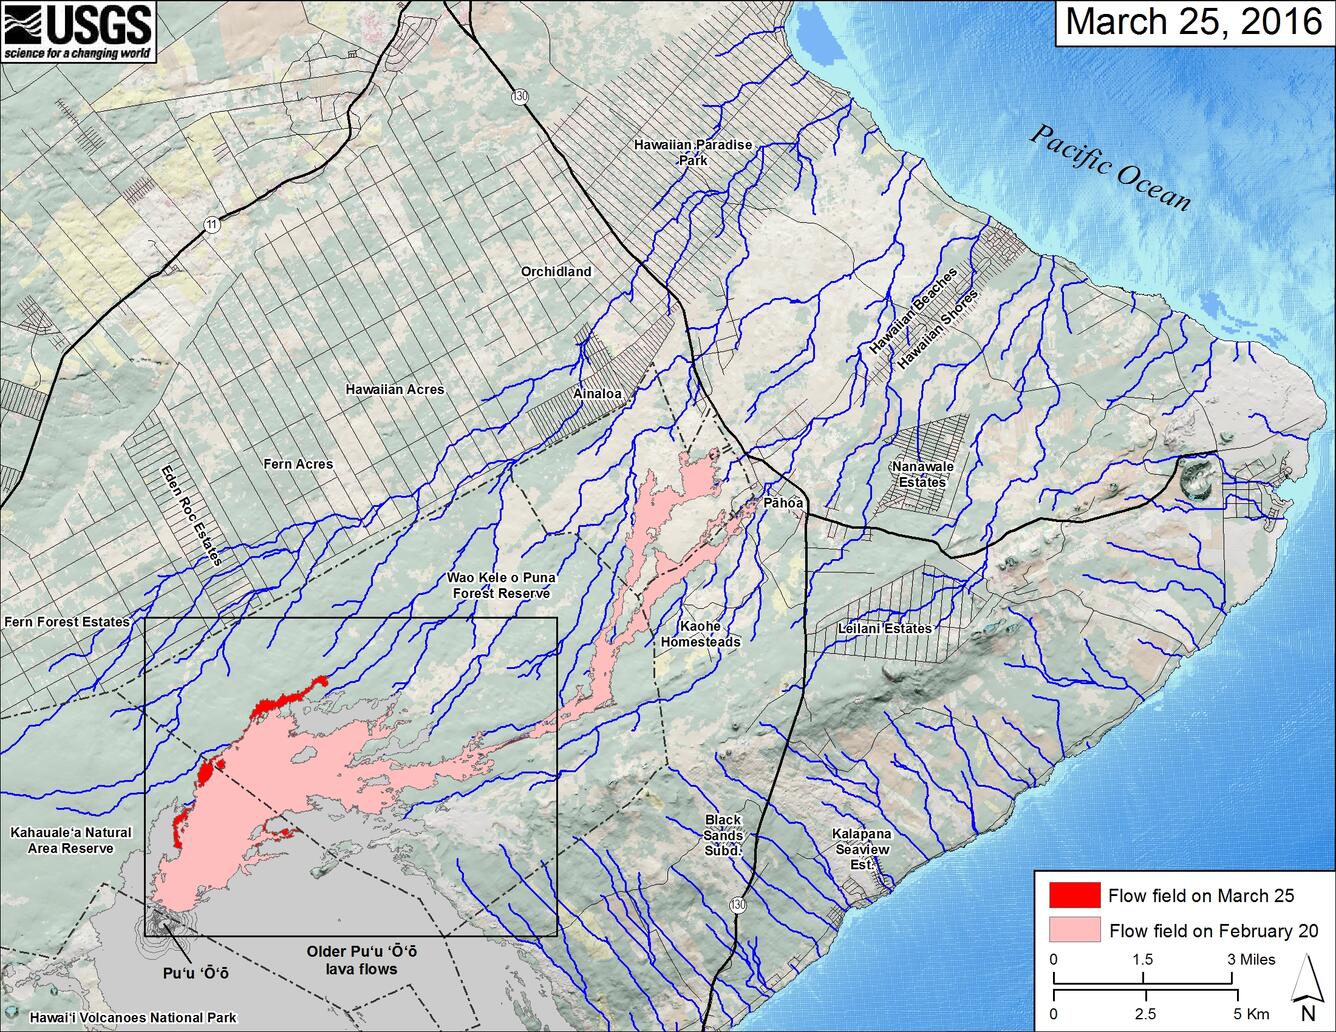
This small-scale map shows Kīlauea's June2th lava flow boundaries on March 25, 2016, in relation to the eastern part of the Island of Hawai‘i. The area of the flow field on February 20 is shown in pink, while widening and advancement of the flow field as mapped on March 25 is shown in red. Pu‘u ‘Ō‘ō lava flows erupted prior to June 27, 2014, are shown in gray. The black box shows the extent of the accompanying large scale maps.
The blue lines show steepest-descent paths calculated from a 1983 digital elevation model (DEM). Steepest-descent path analysis is based on the assumption that the DEM perfectly represents the earth's surface. DEMs, however, are not perfect, so the blue lines on this map can be used to infer only approximate potential flow paths. The base map is a partly transparent regional land cover map from National Oceanic and Atmospheric Administration (NO‘A‘ā) Office of Coastal Management draped over a 1983 10-m digital elevation model (DEM). The bathymetry is also from NO‘A‘ā.
Sources/Usage
Public Domain.
Kauahikaua, 2007