
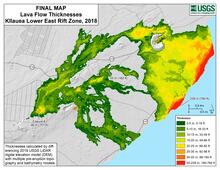
Kīlauea 2018 lower East Rift Zone lava flow thicknesses

Detailed Description
Data depicted on this map of Kīlauea lower East Rift Zone lava flow thicknesses are derived from a 2019 USGS topographic survey that utilized a helicopter-mounted light detection and ranging (LiDAR) sensor. The post-eruption elevations measured by this survey were compared to elevations in pre-eruption surveys—which depicted both the land surface and ocean floor—to determine the thickness of lava flows emplaced in 2018. This "final" map replaces the "preliminary" map of lava flow thicknesses that was released on 19 February 2019, and there are some minor but notable differences between the two maps. First, the new LiDAR survey revealed the greatest thickness on land to be near the Halekamahina neighborhood, where fissure 17 lava flows filled a preexisting ground crack to a depth of 55 m (180 ft). Second, fissure 8 was found to be slightly shorter than originally measured, at 46 m (151 ft) above the pre-eruption ground surface. Third, the greatest thickness in the lava delta (new land created where lava entered the ocean) is also reduced by about 40 m (130 ft), due to erosional retreat of the coastline between the end of ocean entry activity in August 2018 and the time of the survey in July 2019.
Sources/Usage
Public Domain.