
Large-scale map of June 27th flow in Kīlauea's ERZ
Detailed Description
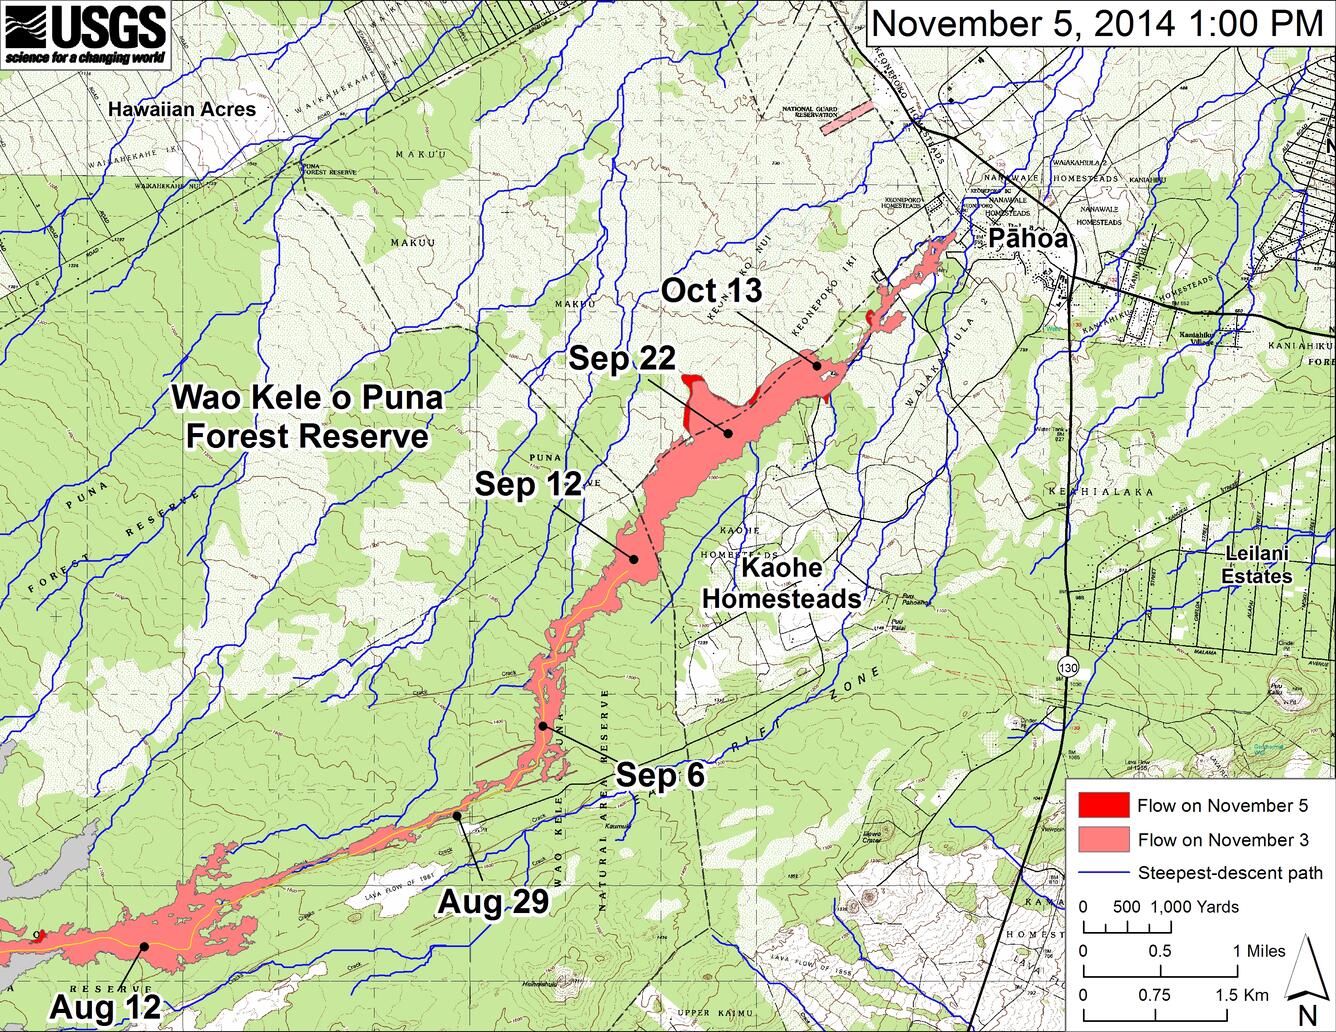
This large-scale map shows the distal part of the June 27th flow in relation to nearby Puna communities. The area of the flow on November 3, 2014, at 11:30 AM is shown in pink, while widening and advancement of the flow as mapped on November 5, at 1:00 PM is shown in red. Surface activity occurred along the north margin of the flow 335 meters (366 yards) and 2.5 kilometers (1.5 miles) upslope of AP‘A‘ā Street. In addition, there was breakout activity along the south margin at 1.2 kilometers (0.75 miles) mauka of AP‘A‘ā Street.
The blue lines show steepest-descent paths calculated from a 1983 digital elevation model (DEM; for calculation details, see http://pubs.usgs.gov/of/2007/1264/). Steepest-descent path analysis is based on the assumption that the DEM perfectly represents the earth's surface. DEMs, however, are not perfect, so the blue lines on this map can be used to infer only approximate flow paths.
Sources/Usage
Public Domain.