
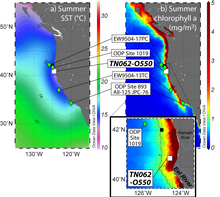
Location of Study Site TN062-0550
2017 (approx.)

Detailed Description
Figure 1. Location map of the study site TN062-O550 andd other sites plotted on: (a) summer climatological mean sea surface temperature (Locarnini et al., 2010); and (b) SeaWiFS chlorophyll a mean summer (JAS) productivity (Hu et al., 2012). Base maps plotted in Ocean Data Viewer (Schlitzer, 2015). (modified from Figure 1 in Addison et al., 2017)
Sources/Usage
Public Domain.