
Magnetic declination changes over time

Detailed Description
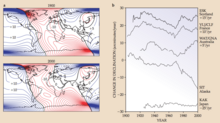
Figure 3. Magnetic declination changes over time. (a) Contour maps of declination D for the years 1900 and 2000 show significant differences over the century. Each contour line represents 5°; red is declination to the west and blue is to the east.
(b) Data from five observatories show the yearly rate of change in declination. Note, in particular, the abrupt changes, or jerks, in the rate of secular variation, around 1970. For clarity of presentation, the data have been separated by the ordinate values listed on the right.
Sources/Usage
Public Domain.