



Mapping changes in seasonal water use patterns with Landsat ETa


Detailed Description
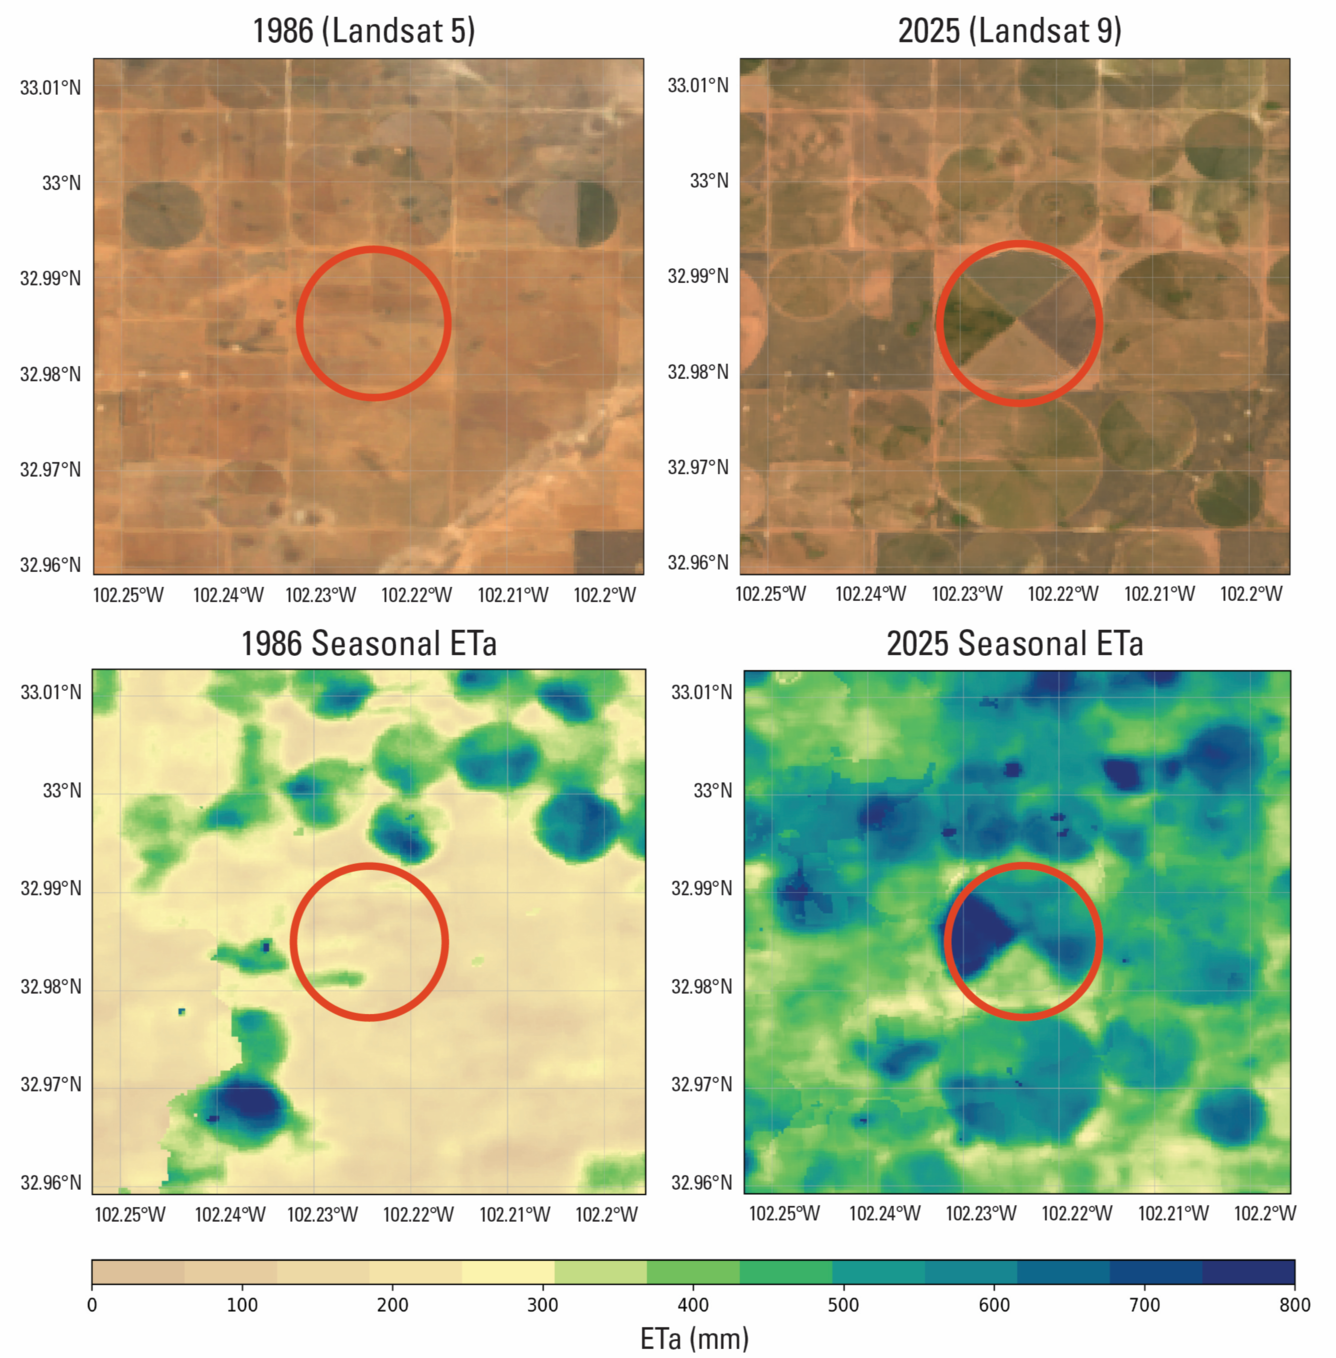
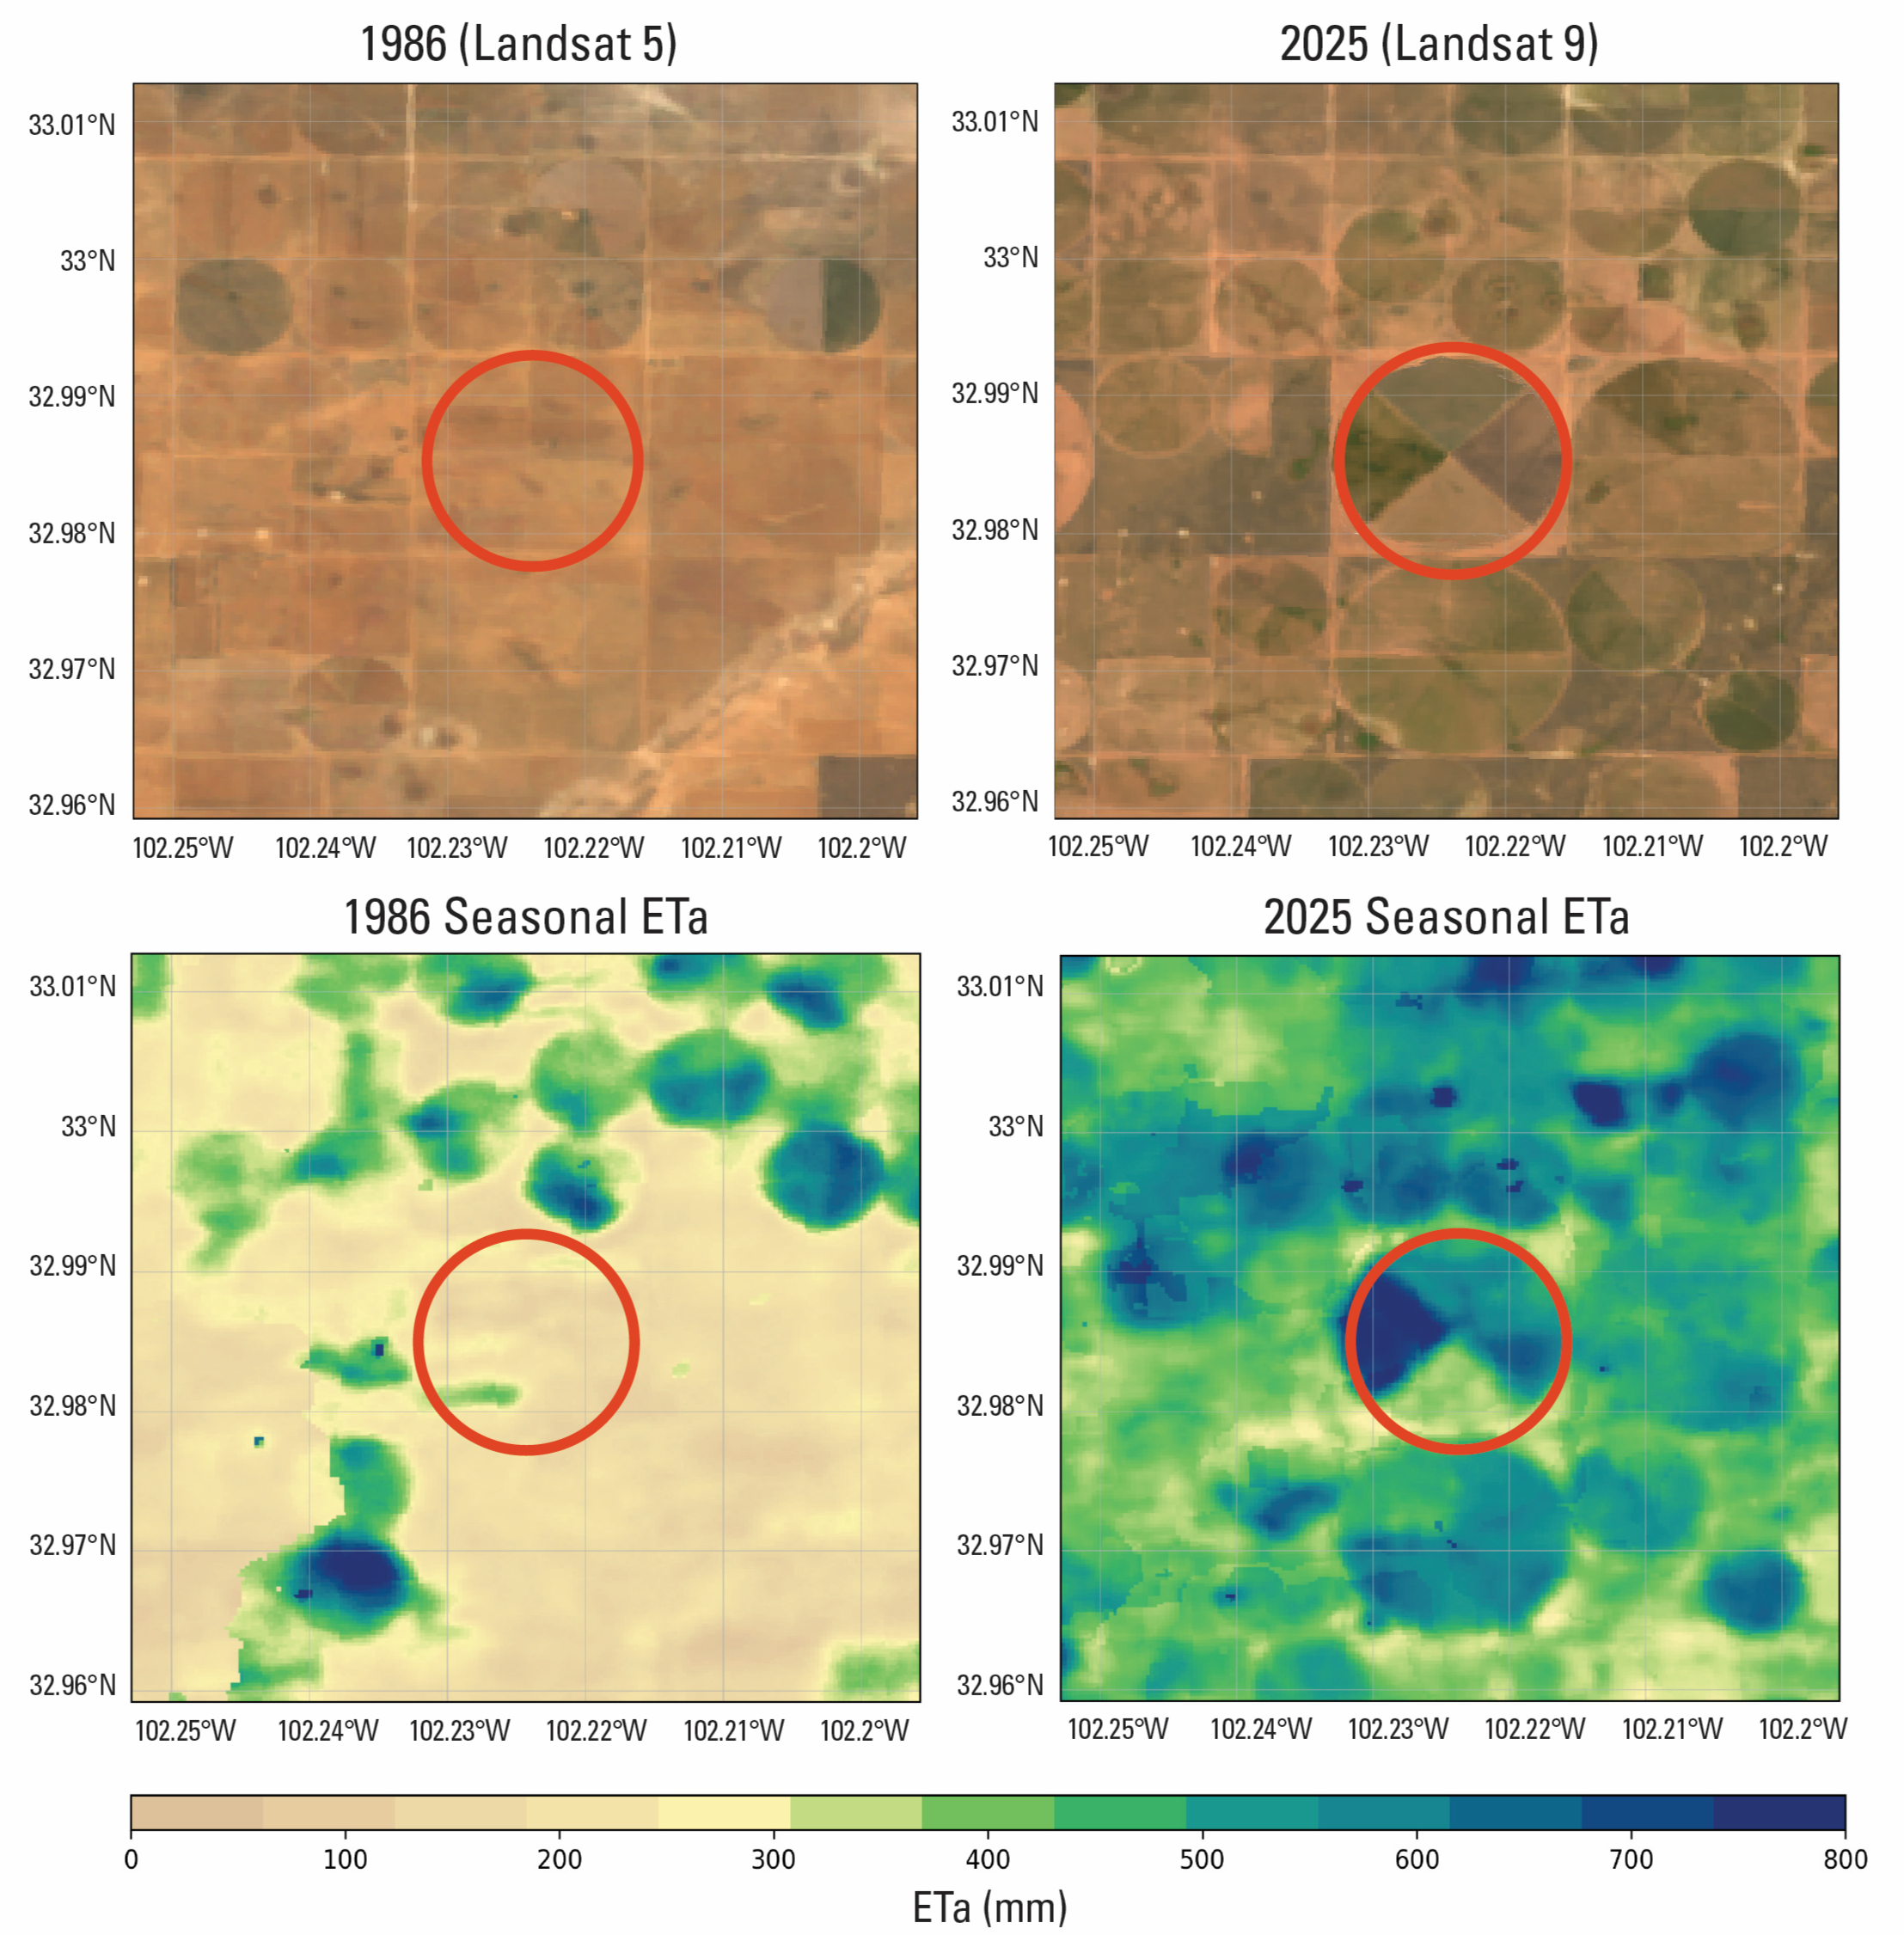
These images illustrate how Landsat Provisional Actual Evapotranspiration (ETa) data can be used to map and quantify changes in seasonal water‑use patterns (April–September). True‑color, 30‑meter images and their corresponding seasonal ETa maps are displayed for a field near Lubbock, Texas, in 1986 and 2025. Landsat Path 30, Row 37.
Sources/Usage
Public Domain.