
Landsat Collection 2 Provisional Actual Evapotranspiration Science Product
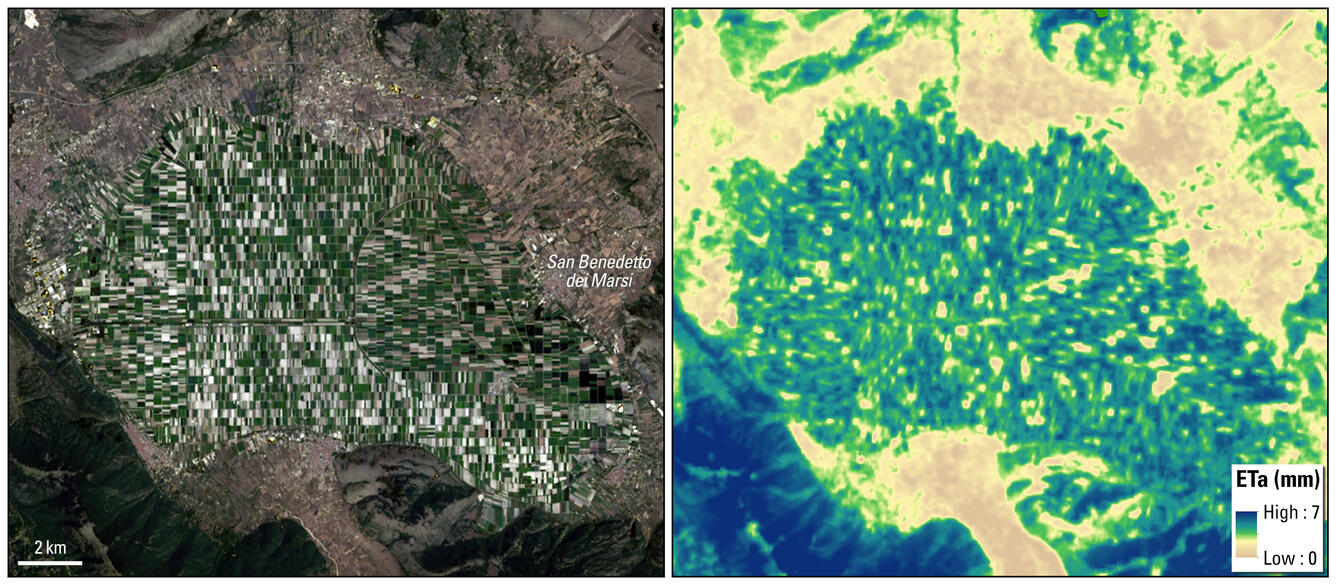
Actual Evapotranspiration (ETa) is the quantity of water that is removed from a surface due to the processes of evaporation and transpiration and is measured in millimeters (mm). ETa can be fundamental in the understanding of the spatiotemporal dynamics of water use over land surfaces.
Return to Landsat Actual Evapotranspiration Overview
Go to Landsat Science Products Overview
Landsat Collection 2 (C2) Provisional ETa Science Products are available globally for Landsat 4-5 Thematic Mapper (TM), Landsat 7 Enhanced Thematic Mapper Plus (ETM+), and Landsat 8-9 Operational Land Imager/Thermal Infrared Sensor (OLI/TIRS) scenes that can be successfully processed to C2 Level-2 Surface Temperature products.
Landsat C2 Provisional ETa products are generated by solving the surface energy balance equation for the latent heat flux using a robust model. The surface energy balance model used in this ETa calculation is directly derived from the Operational Simplified Surface Energy Balance (SSEBop) model (Senay et al., 2013; Senay, 2018; Senay et al., 2022a; Senay et al., 2022b). The Landsat C2 Level-2 Surface Temperature is input to a SSEBop model with external auxiliary data to retrieve the daily total of ETa.
The SSEBop model is based on the Simplified Surface Energy Balance (SSEB) approach (Senay et al., 2007, 2011) with a unique parameterization for operational applications. It combines evapotranspiration (ET) fractions generated from Landsat C2 Surface Temperature with reference ET using a thermal index approach based on the principle of satellite psychrometry (Senay, 2018). The unique feature of the SSEBop parameterization is that it uses pre-defined, seasonally dynamic, boundary conditions that are specific to each pixel for the “hot/dry” and empirically derived “cold/wet” reference points. Senay, (2018) provides additional information about the SSEBop algorithm.
The Landsat C2 Surface Temperature product and auxiliary data are required for successful processing of the ETa product. The ETa auxiliary data include the temperature difference between hot/dry and cold/wet limits (dT), maximum daily air temperature (Ta), and alfalfa-reference ET (ETr) data.
The dT dataset is determined using net radiation inputs under gray-sky conditions and is derived from the European Centre for Medium-Range Weather Forecasts (ECMWF) Reanalysis v5 (ERA5) (Kagone and Senay 2022). The maximum daily air temperature is a 1981-2010 climatological normal of Daymet Version 4 over North America and 1981-2010 climatological normal from the CHELSA Version 2 dataset for all other areas outside of North America (Karger et al., 2021; Thornton et al., 2020).
The alfalfa-reference ETr data is a fusion of several different remote sensing and modeling products: 1981-2010 climatological normal ETr from Gridmet over the continental United States and MERRA-2 Fine Resolution ETr for all areas outside of the continental United States that has been scaled and corrected via terrestrial ecoregions form OneEarth and scaled Worldclim Version 3 ETo (Abatzoglou 2013; Dinerstein et al., 2017; Hobbins et al., 2022; Zomer et al., 2022). The auxiliary data for ETa calculation is pre-processed, so it is not a dominating factor in the ETa product generation latency.
Note: These data are provisional and are subject to revision. They are being provided to meet the need for timely best science. The data have not received final approval by the U.S. Geological Survey (USGS) and are provided on the condition that neither the USGS nor the U.S. Government shall be held liable for any damages resulting from the authorized or unauthorized use of the data.
Product Availability
C2 Provisional ETa products are available for Landsat 4-5 TM, Landsat 7 ETM+, and Landsat 8-9 OLI/TIRS scenes acquired globally that can be successfully processed to a C2 Level-2 Surface Temperature product. For new Landsat acquisitions, the C2 Provisional ETa products are available to order 4-10 days after Landsat 8 acquisitions, and about 3 days after Landsat 9 acquisitions.
Improvements and Changes from Collection 1
Listed below are items that have been improved and/or changed in C2 Provisional ETa, compared to Collection 1 Provisional ETa products:
- C2 Provisional ETa is available globally, whereas Collection 1 Provisional ETa is only available over the conterminous United States (CONUS).
- Availability of Landsat 9 C2 Provisional ETa products
- C2 Provisional ETa uses an improved parameterization of the SSEBOp model.
- Unlike the C1 ETa workflow where Surface Temperature was processed internally by ESPA, a C2 Level-2 Science Product (L2SP) productID must be submitted to process C2 ETa.
Package Contents
C2 Provisional ETa products are generated at the 30-meter spatial resolution. C2 Provisional ETa packages contain the following files:
Actual Evapotranspiration (ETA): Provides a per-pixel estimate of daily water transfer from the Earth's surface to the atmosphere in units of water depth in millimeters (mm).
ET fraction (ETF): Represents unitless fraction of ETr, nominally varying between 0 and 1 (in SSEBop model the maximum ET fraction is 1.0). This can be used in combination with user provided reference ET (ETr) to create a more accurate ETa which considers local weather conditions.
ET Uncertainty (ETUN): Provides ET product uncertainty in units of water depth (mm) using the ETr auxiliary data.
Level 2 Pixel Quality Assessment (QA_PIXEL): The bit combinations that define certain quality conditions. More information about Pixel Quality Assessment can be found in the Landsat 4-7 Collection 2 Level 2 Science Product Guide and Landsat 8-9 Collection 2 Level 2 Science Product Guide.
Metadata: Includes Actual Evapotranspiration Landsat scene information in XML format (Product_ID.xml) and Level-1 metadata in.txt and XML format.
Caveats and Constraints
- Current C2 Actual ETa science products are considered provisional. The ET algorithm outputs that are generated using C2 Surface Temperature which has not been completely validated. In preliminary validations, the daily and monthly Landsat ETa compared reasonably well with the in-situ data obtained from Eddy-Covariance Flux Towers from the Ameriflux network (Senay et al., 2017; Senay et al., 2019; Senay et al., 2022a; Senay et al., 2022b). For additional information about the preliminary validation details, see the References section.
- Both reflective and thermal Landsat bands are required for the successful processing of the C2 ETa science product. Therefore OLI-only or TIRS-only Landsat 8 or Landsat 9 scenes cannot be processed to ETa.
- It is important to note that there are two major products: ET fraction (ETf) and actual ET (ETa). The ETa is based on the product of ETf and a climatology (long term normal) reference ET (ETr). Because the ETr is a climatology and does not capture the day-to-day weather variability, comparison against flux tower data may produce relatively larger deviations on a given day, but this effect would be minimized when the ETa data are aggregated to larger time scales such as monthly. Users are encouraged to use the provided ETf with the best available ETr for the corresponding day for evaluating the performance of the model against daily flux towers or other independent datasets. However, the ETa data are expected to capture the spatial variability adequately.
- The Actual ET product may contain NoData pixels within the valid areas of the Landsat scene. These NoData pixels are usually the cloud, cloud shadow, or pixels with radiometric saturation that are masked. They could also be due to missing ASTER GED auxiliary data required for C2 ST processing. For additional information please visit the Landsat Collection 2 Surface Temperature data gaps due to missing ASTER GED webpage.
- The Landsat Collection 2 Level-2 ST is the primary input to the ETa algorithm. The blockiness artifact present in Collection 2 ST can also appear in C2 ETa. For further information, please refer to the Landsat Collection 2 Known Issues webpage.
Data Access
Landsat 4-9 C2 Provisional ETa products are available from the USGS EROS Science Processing Architecture (ESPA) On-demand Interface. A valid C2 Level-2 Science Product (L2SP) product ID must be submitted to process C2 Provisional ETa products.
The default projection system for all Landsat science products is Universal Transverse Mercator (UTM), but another projection can be selected. The default file format is Georeferenced Tagged Image File Format (GeoTIFF), but other data formats are available. ESPA also offers additional customization services such as spatial subsetting, and pixel resizing. More information about ESPA’s processing options can be found in the ESPA On-Demand Interface User Guide. Information about bulk download options can be found on the Landsat Data Access web page.
Documentation
Landsat 4-9 Collection 2 Level-3 Provisional Actual Evapotranspiration Product Guide
Citation Information
There are no restrictions on the use of Landsat science products. It is not a requirement of data use, but the following citation may be used in publication or presentation materials to acknowledge the USGS as a data source and to credit the original research.
Landsat Collection 2 Level-3 Provisional Actual Evapotranspiration Science Product courtesy of the U.S. Geological Survey.
Senay, G.B. (2018). Satellite psychrometric formulation of the operational Simplified Surface Energy Balance (SSEBop) Model for quantifying and mapping Evapotranspiration. Applied Engineering in Agriculture, 34(3),555-566. https://doi.org/10.13031/aea.12614
Senay GB, Parrish GEL, Schauer M, Friedrichs M, Khand K, Boiko O, Kagone S, Dittmeier R, Arab S, Ji L. (2023). Improving the Operational Simplified Surface Energy Balance Evapotranspiration Model Using the Forcing and Normalizing Operation. Remote Sensing, 15(1):260. https://doi.org/10.3390/rs15010260
Reprints or citations of papers or oral presentations based on USGS data are welcome to help the USGS stay informed of how data are being used. These can be sent to USGS EROS Customer Services.
References
Abatzoglou, J. T. (2013). Development of gridded surface meteorological data for ecological applications and modelling. International Journal of Climatology, 33(1), 121-131. https://doi.org/10.1002/joc.3413
Allen, R.G., Tasumi, M., Trezza, R., 2007. Satellite-based energy balance for mapping evapotranspiration with internalized calibration (METRIC) – Model. ASCE J. Irrigation and Drainage Engineering 133, 380-394. https://doi.org/10.1061/(ASCE)0733-9437(2007)133:4(380)
Bastiaanssen, W.G.M., M. Menenti, R.A. Feddes, and A. A. M. Holtslag, 1998. The surface energy balance algorithm for land (SEBAL): Part 1 formulation. Journal of Hydrology 212–213: 198–212. https://doi.org/10.1016/S0022-1694(98)00253-4
Dinerstein, E., Olson, D., Joshi, A., Vynne, C., Burgess, N. D., Wikramanayake, E., … & Saleem, M. (2017). An ecoregion-based approach to protecting half the terrestrial realm. BioScience, 67(6), 534-545. https://doi.org/10.1093/biosci/bix014
Ji, L., Senay, G., Velpuri, N., & Kagone, S. (2019). Evaluating the Temperature Difference Parameter in the SSEBop Model with Satellite-Observed Land Surface Temperature Data. Remote Sensing 11 (16): 1947. https://doi.org/10.3390/rs11161947
Kagone, S., and Senay, G.B., 2022, Global gray-sky dT: the inverse of the surface psychrometric constant parameter in the SSEBop evapotranspiration model: U.S. Geological Survey data release, https://doi.org/10.5066/P9JBW6R9.
Hobbins, M., Dewes, C., and Jansma, T., 2022, Global reference evapotranspiration for food-security monitoring: U.S. Geological Survey data release, https://doi.org/10.5066/P9IIQMV1.
Senay, G. B. (2018). Satellite psychrometric formulation of the Operational Simplified Surface Energy Balance (SSEBop) model for quantifying and mapping evapotranspiration. Applied engineering in agriculture, 34 (3), 555-566. https://doi.org/10.13031/aea.12614
Senay, G. B., Budde, M. E., & Verdin, J. P. (2011). Enhancing the Simplified Surface Energy Balance (SSEB) approach for estimating landscape ET: Validation with the METRIC model. Agricultural Water Management, 98(4), 606-618. https://doi.org/10.1016/j.agwat.2010.10.014
Senay, G. B., Budde, M., Verdin, J. P., & Melesse, A. M. (2007). A coupled remote sensing and simplified surface energy balance approach to estimate actual evapotranspiration from irrigated fields. Sensors, 7(6), 979-1000. https://doi.org/10.3390/s7060979
Senay, G., Bohms, S., Singh R., Gowda, P., Velpuri, N., Alemu H., & Verdin, J. (2013). Operational Evapotranspiration Mapping Using Remote Sensing and Weather Datasets: A New Parameterization for the SSEB Approach. Journal of the American Water Resources Association 49 (3): 577-591. https://doi.org/10.1111/jawr.12057
Senay, G., Friedrichs, M., Singh, R., & Velpuri, N. (2016). Evaluating Landsat 8 evapotranspiration for water use mapping in the Colorado River Basin. Remote Sensing of Environment 185: 171-185. https://doi.org/10.1016/j.rse.2015.12.043
Senay, G., Schauer, M., Friedrichs, M., Velpuri, N., Singh, R. (2017). Satellite-based water use dynamics using historical Landsat data (1984–2014) in the southwestern United States. Remote Sensing of Environment 202: 98-112. https://doi.org/10.1016/j.rse.2017.05.005
Senay, G. B., Friedrichs, M., Morton, C., Parrish, G. E., Schauer, M., Khand, K., ... & Huntington, J. (2022a). Mapping actual evapotranspiration using Landsat for the conterminous United States: Google Earth Engine implementation and assessment of the SSEBop model. Remote Sensing of Environment, 275, 113011.
Senay, G.B., G. Parrish, M. Schauer, M. Friedrichs, K. Khand, O. Boiko, S. Kagone, and Lei Ji. (2022b). Improving the Operational Simplified Surface Energy Balance evapotranspiration model using the Forcing and Normalizing Operation. Remote Sensing. Under Preparation.
Schauer, M.P., Senay, G.B., and Kagone, S., (2022), High Resolution Daily Global Alfalfa-Reference Potential Evapotranspiration Climatology: U.S. Geological Survey data release, https://doi.org/10.5066/P9R877Q8.
Singh, R., Senay, G., Velpuri, N., Bohms, S., Scott, R., & Verdin, J. (2014). Actual Evapotranspiration (Water Use) Assessment of the Colorado River Basin at the Landsat Resolution Using the Operational Simplified Surface Energy Balance Model. Remote Sensing 6 (1): 233-256. https://doi.org/10.3390/rs6010233
Thornton, M.M., R. Shrestha, Y. Wei, P.E. Thornton, S. Kao, and B.E. Wilson. 2020. Daymet: Daily Surface Weather Data on a 1-km Grid for North America, Version 4. ORNL DAAC, Oak Ridge, Tennessee, USA. https://doi.org/10.3334/ORNLDAAC/1840
Zomer, R.J., Xu, J., Trabucco, A. 2022 Global Aridity Index and Potential Evapotranspiration (ET0) Database: Version 3. Scientific Data (In revision).