
Modeled Representative Concentration Pathways, Bay-Delta, 2070-2099

Detailed Description
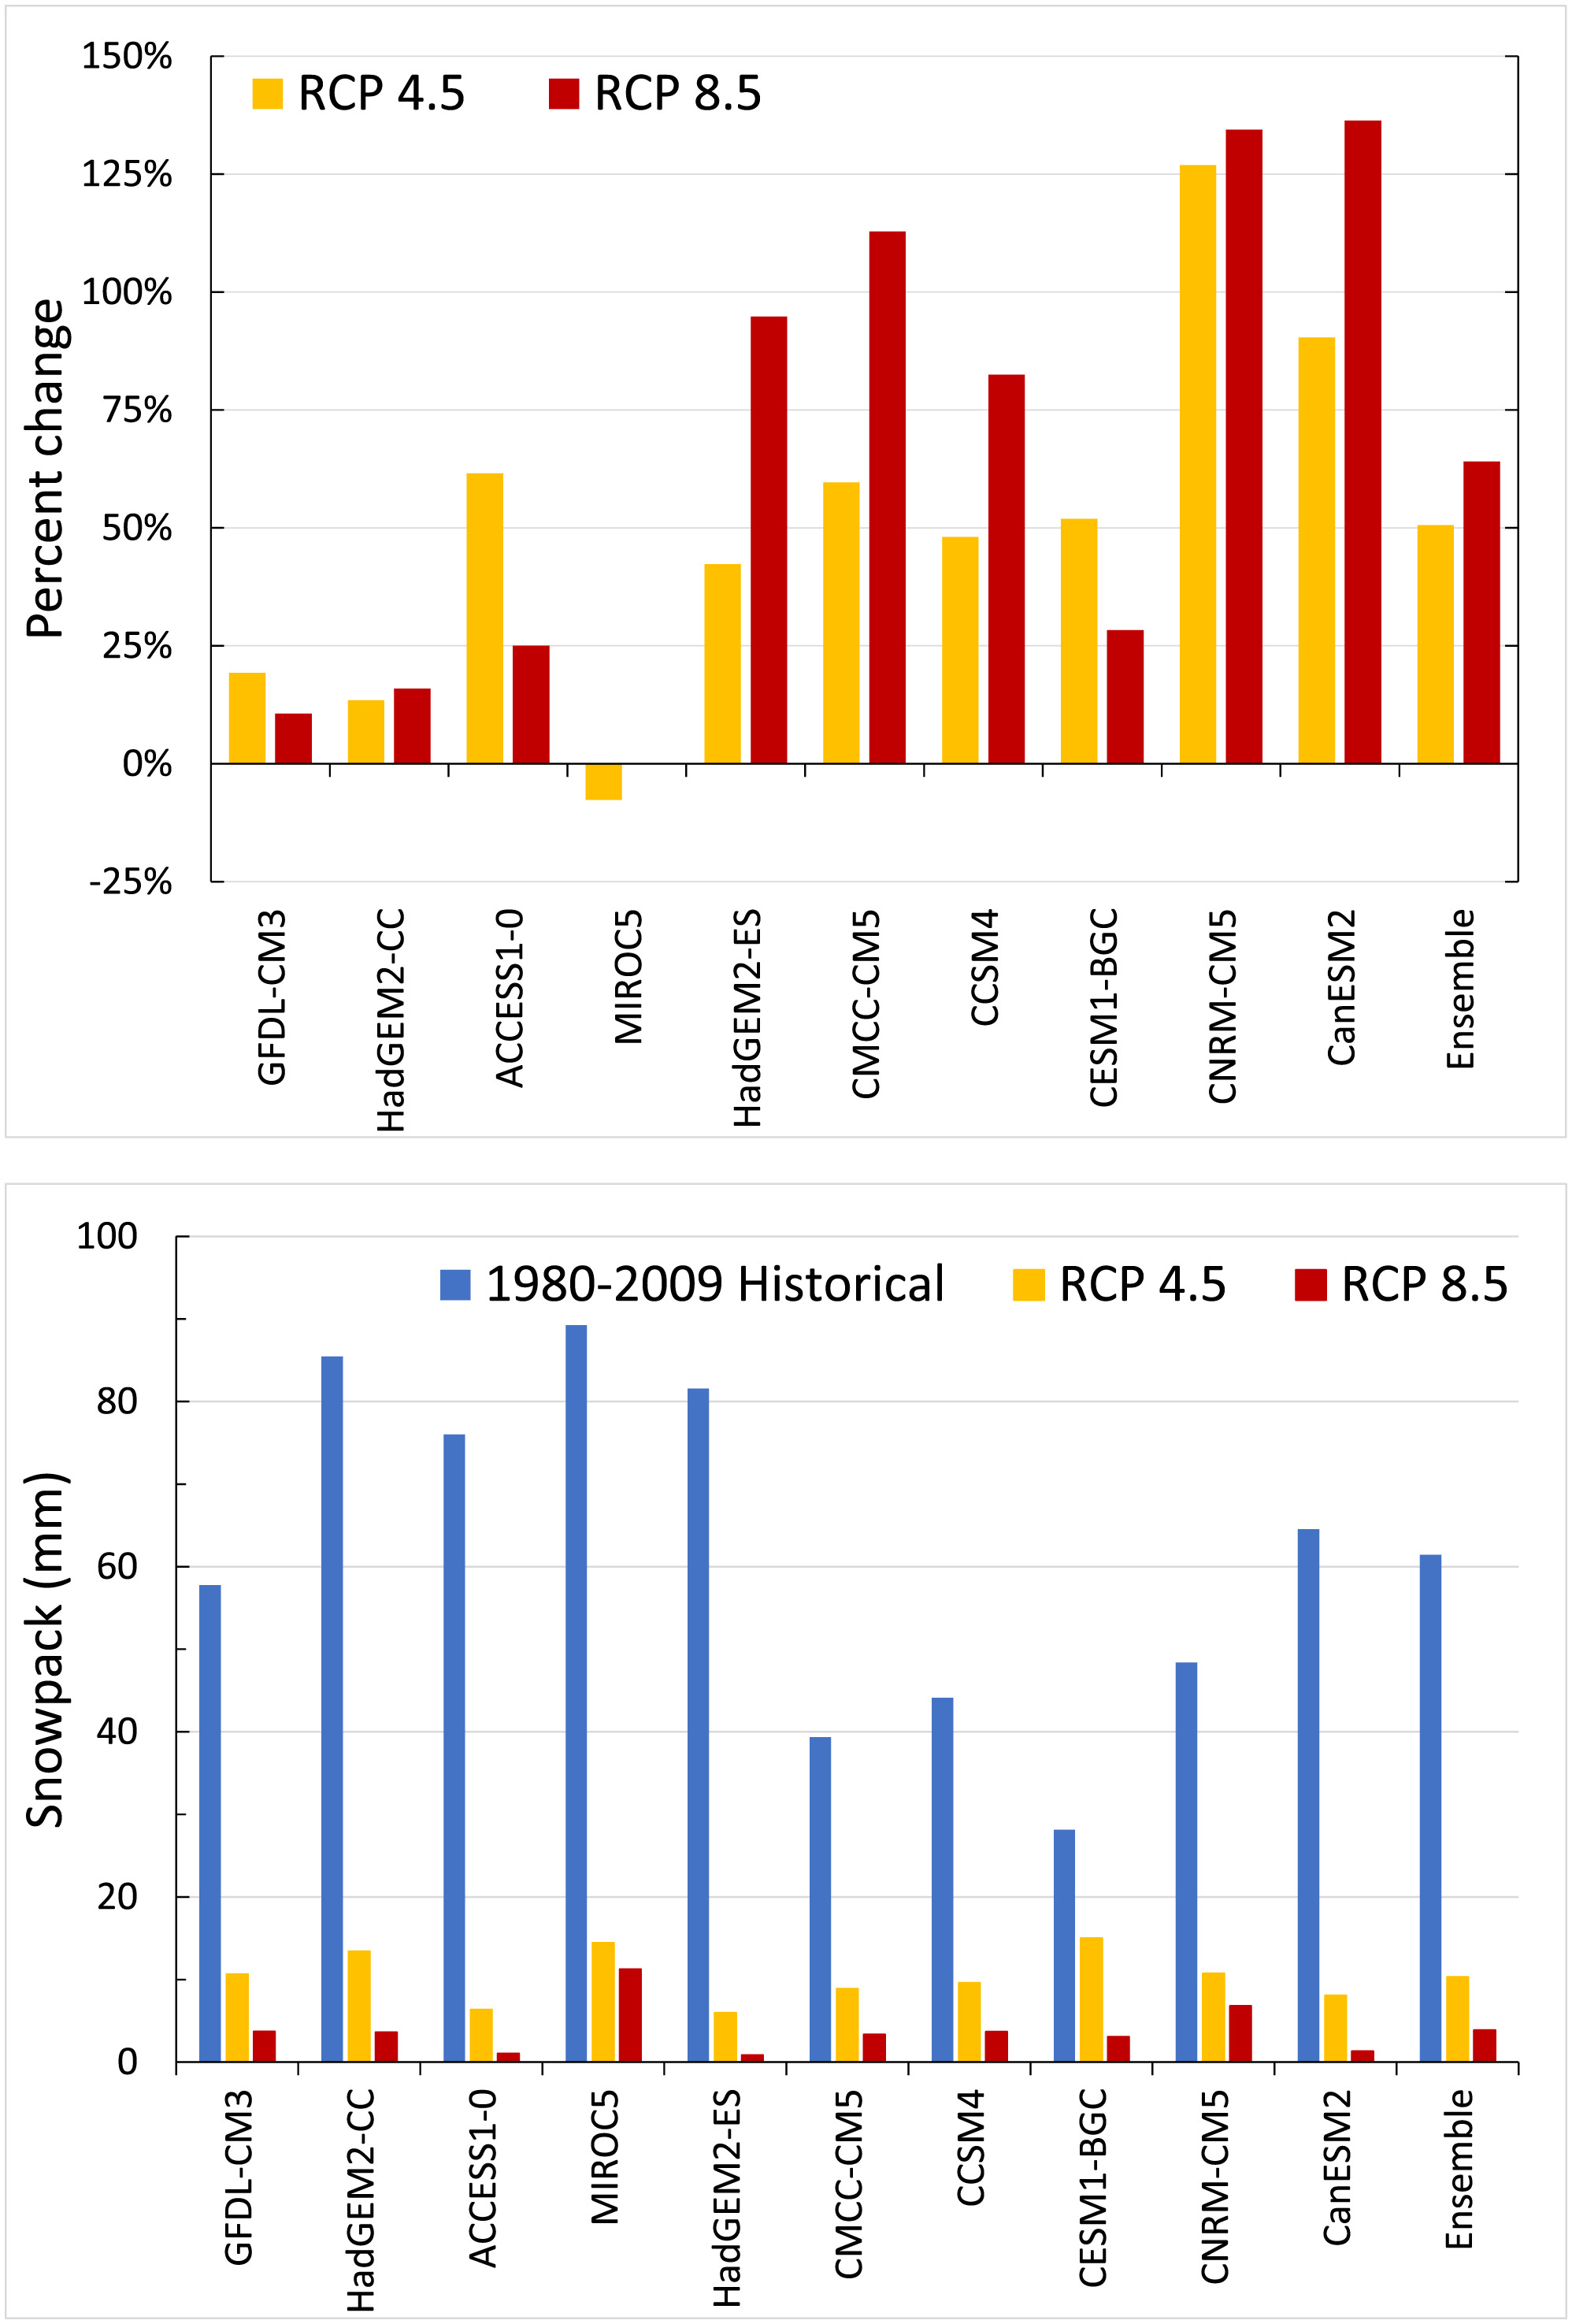
Percent change in peak precipitation days (>95th percentile) (top panel), April 1st snow water equivalent (mm) by end‐of‐century (2070–2099) (bottom panel) compared to historical baseline (1980–2009) for 10 models for representative concentration pathways (RCP) 4.5 and 8.5, and ensemble averages.