
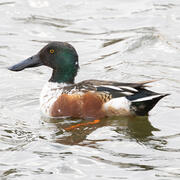
Models predicting spatial abundance of Northern Shoveler
By Eastern Ecological Science Center
2019 (approx.)
Detailed Description
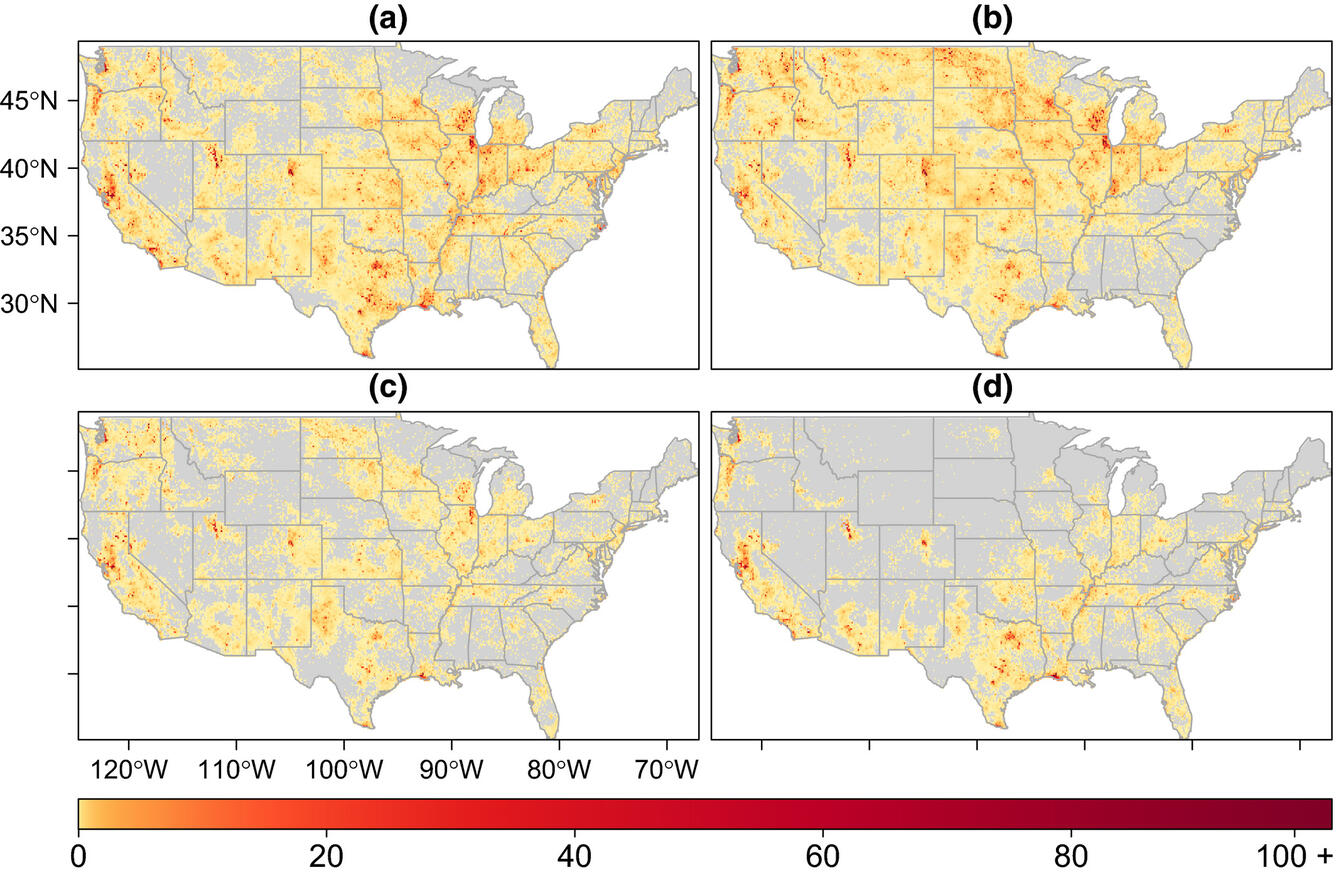
Figures show predicted abundance for the (a) spring, (b) breeding, (c) fall and (d) winter seasons for Northern Shoveler (Anas clypeata). The figure legend is scaled from 0 to 100+ birds/km2 with lighter yellow colors signifying lower bird densities and darker reds emphasizing locations with relatively higher abundance. Originally published in Humphreys et al. (2019, Diversity and Distributions).
Sources/Usage
Public Domain.
Related
Developing Waterfowl Distribution and Abundance Models to Inform Avian Influenza Transmission Risk
USGS researchers are developing novel methods to improve our understanding of waterfowl distributions and abundance across the United States to inform a variety of ongoing disease studies. Understanding the distribution of wild waterfowl is a critical component to assessing avian influenza transmission risks across the landscape.