
MODPATH-OBS_distance-direction-observations_USGS-hydrologic-mod

Detailed Description
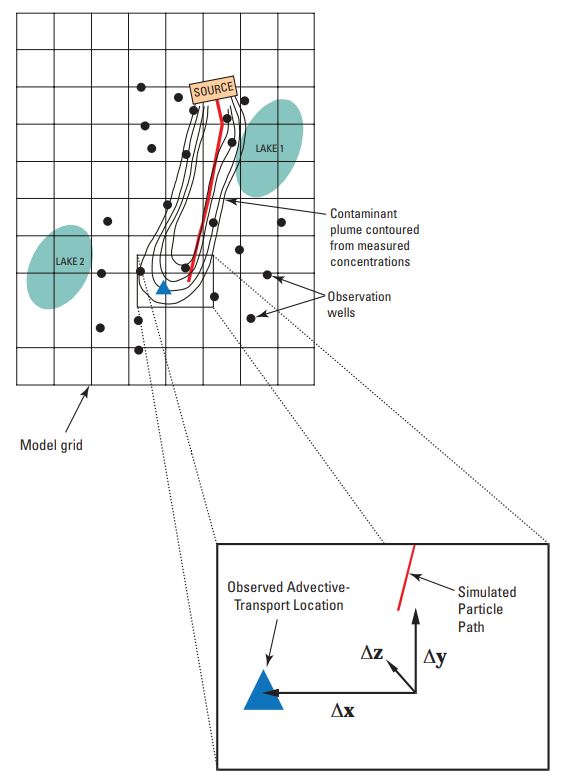
Conceptual representation of distance and direction observations. [The cells are 1,500-meter squares. Contours show boron concentrations of 400, 300, 200 and 100 micrograms per liter. The source concentration is poorly defined and probably changed over time, and the approximate nature of the source contributes to uncertainty of the observation. The blue triangle shows the approximated location of the advective front of the plume, and can be used as the observation location for a proximity observation. This point then becomes the reference point for the observation, with a distance of zero. The red line shows a simulated particle path. The end of the path is compared to the observation location, and the total distance between them, or component distances in any of the three axis directions, can be used as simulated values. Figure modified from Anderman and Hill, 2001.
Sources/Usage
Public Domain.