



Monthly Mean Crop Irrigation Water Use in New England
By New England Water Science Center
March 2025 (approx.)


Detailed Description
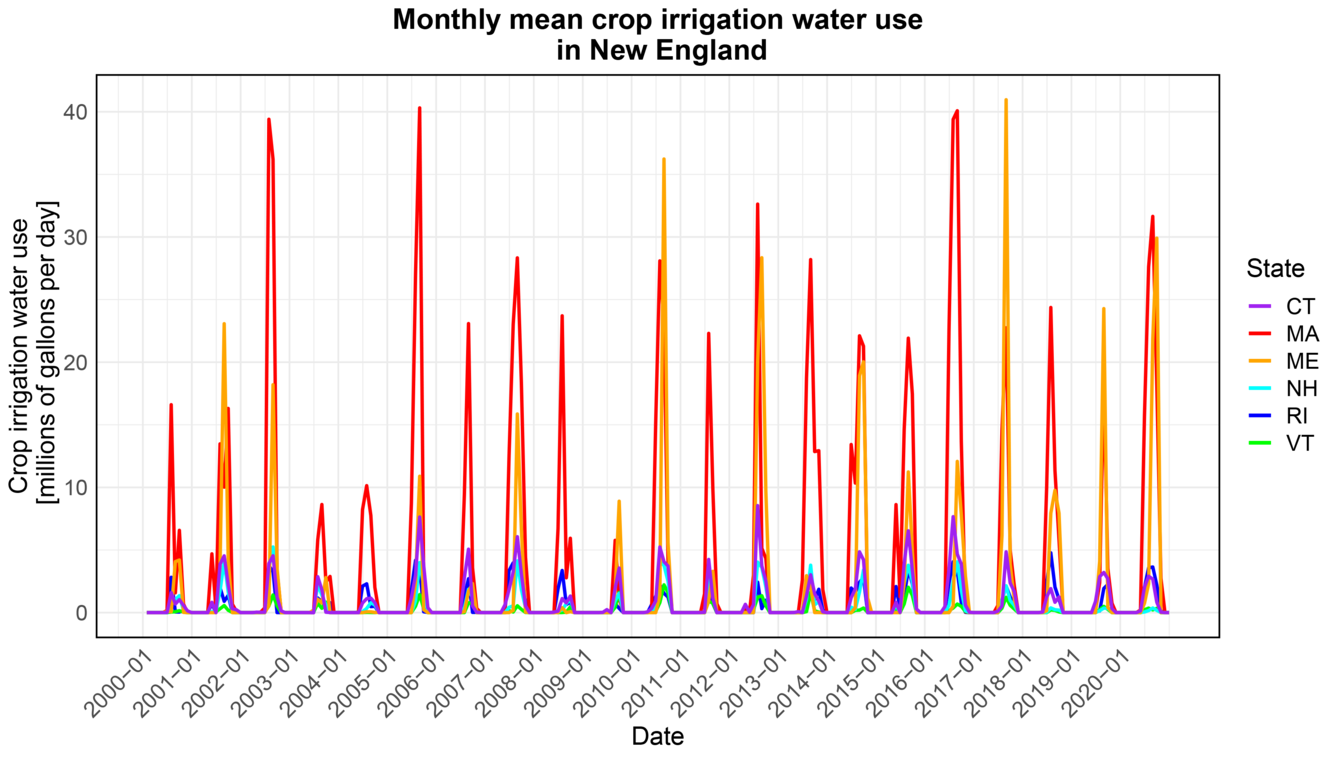
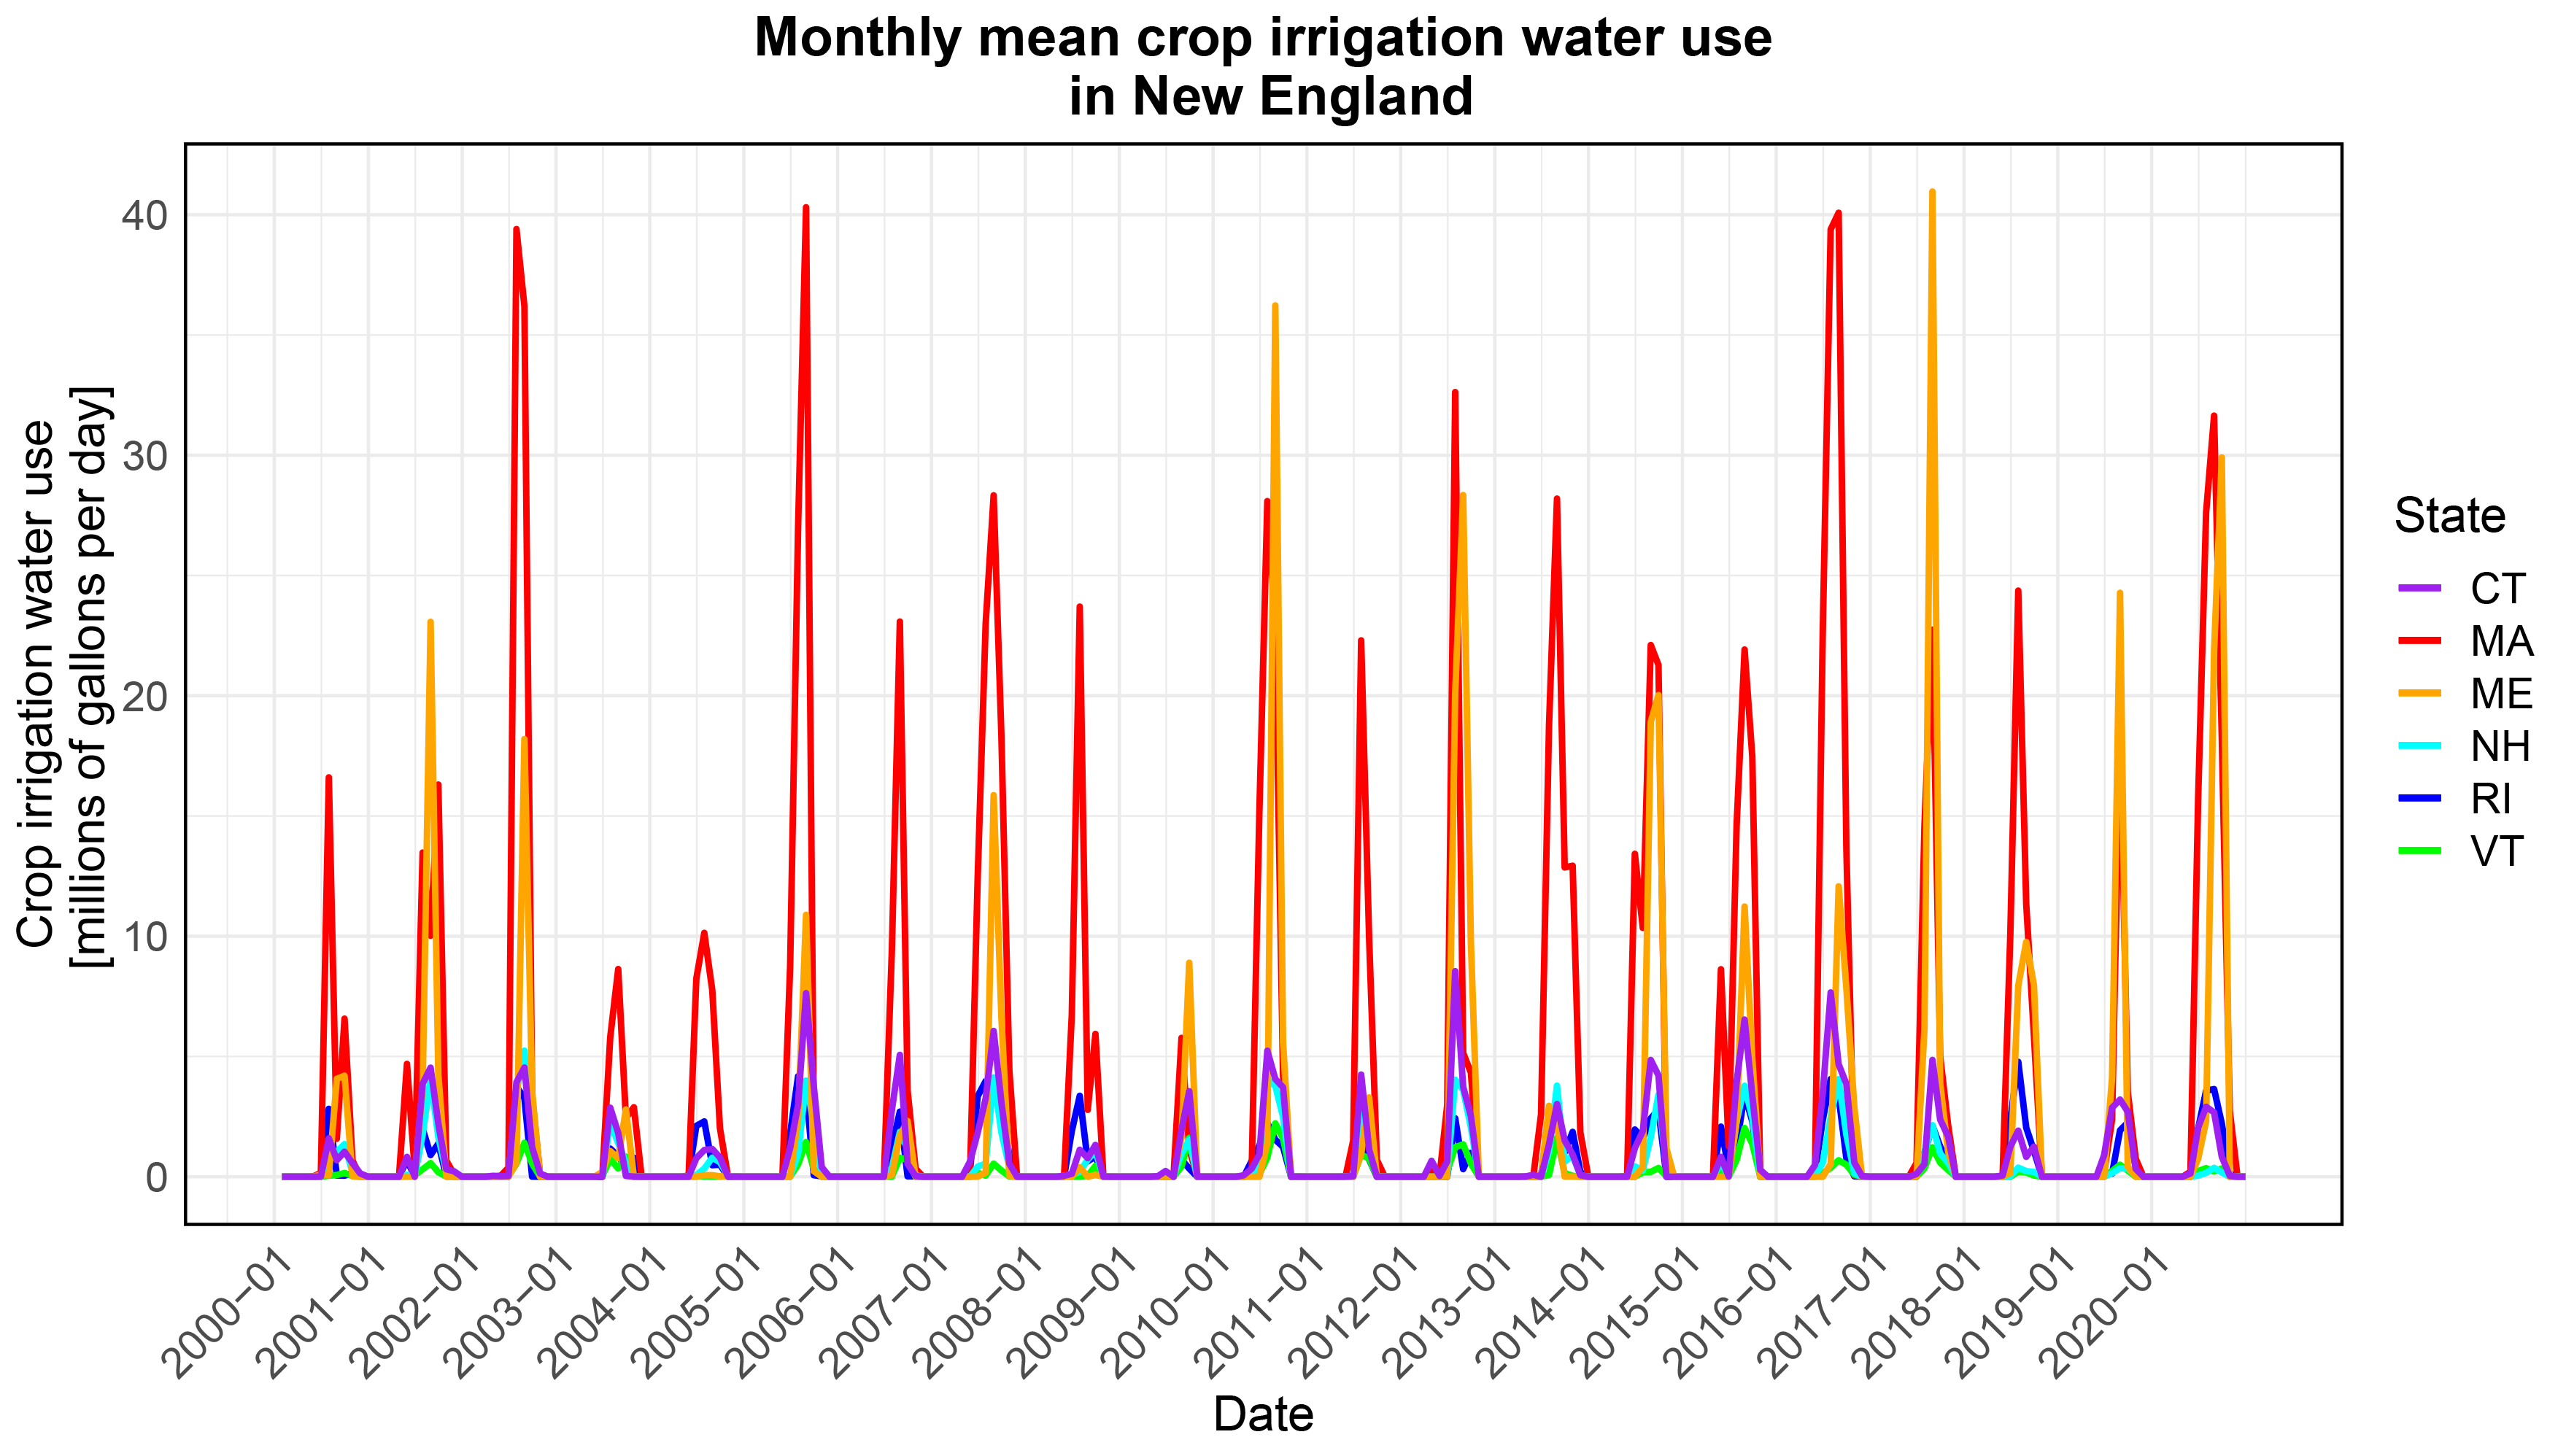
This graph shows the monthly mean rate of water used for crop irrigation (in millions of gallons per day) from 2000 to 2020 for each state in New England. Data from Haynes and others, 2024 (https://doi.org/10.5066/P9LGISUM).
Sources/Usage
Public Domain.
Related

New England Water Use
Water use research in the New England Water Science Center serves both regional and national interests. USGS works with our New England partners in all six states to address questions about water demand, availability, and sustainability. Additionally, the New England Water Science Center contributes to national water use research and ensures that New England is well and accurately represented in...
Related
New England Water Use
Water use research in the New England Water Science Center serves both regional and national interests. USGS works with our New England partners in all six states to address questions about water demand, availability, and sustainability. Additionally, the New England Water Science Center contributes to national water use research and ensures that New England is well and accurately represented in...