
Monthly water use estimates for New England and the rest of the conterminous U.S. are now available for the three largest categories of use in the United States: public supply, crop irrigation, and thermoelectric power generation.
For public supply and crop irrigation, estimates are available for 2000 through 2020, and for thermoelectric power generation, estimates are available for 2008 through 2020.
These new estimates of water use and consumption, available at the small watershed scale (HUC12) and differentiated by groundwater and surface-water sources, were generated via machine learning data-driven models (links are below). Monthly estimates for 2020 for five additional categories of use, self-supplied industrial, domestic, mining, livestock, and aquaculture, are anticipated by the end of 2025.
Machine-learning estimates replace the U.S. Geological Survey’s previous “compiled snapshots” of the Nation's water-use data. Those previous snapshots were compiled at the county, State, and national levels (and intermittently at the regional watershed scale) every 5 years between 1950 and 2015. The latest (2015) report is available here.
- National Water Use Program: additional information about water use in the United States, including links to the data releases for the model estimates and reports describing methods of generating estimates and interpretive products.
- National Water Availability Assessment Data Companion: a server for monthly water-use model estimates for 2000 through 2020 for counties or HUC12s. A tutorial is provided that explains how to download estimates by state.
- USGS Integrated Water Availability Assessments: a status report on water availability for the conterminous U.S. for 2010-20, including chapter D, which is specific to water use.
New England Water-Use Estimates and Interpretive Products
- A predictive analysis of water demand for Providence, Rhode Island.
- Estimating domestic self-supplied water use in Rhode Island, 2014-21.
- Assessment of factors that influence human water demand for Providence, Rhode Island.
- Geonarrative about New England water use, 2015.
- Estimated water withdrawals and return flows in Vermont in 2005 and 2020.
Water Use in New England
For most New England states, public supply is consistently the largest category of freshwater water use. Public supply shows relatively consistent annual water use between 2000 and 2020 with a distinct seasonal component (fig. 1). More water is used in summer compared to winter for activities such as lawn and garden watering, filling swimming pools, and washing vehicles.
Because public supply water use is largely (although not completely) a function of population (Alzraiee and others, 2024), Massachusetts and Connecticut, with the largest populations in New England, use the largest volumes of water for public supply. The population of New England as a whole has seen only moderate growth (6 percent) between 2000 and 2020 (fig. 2). The largest increase was seen in Massachusetts (650,000 people) and the largest percent increase was seen in New Hampshire (13 percent).
Water use for thermoelectric power generation shows wide variability over time and among New England states (fig. 3). New Hampshire, Connecticut, Massachusetts, and Maine have experienced notable reductions in water use for thermoelectric power that begin variously between 2008 and 2015 and continue through 2020. Decreases can be attributed to an overall decline in the number of facilities as conventional and coal-fired plants have been retired (Harris and others, 2025). Figure 3 also shows substantial intra-annual variability in thermoelectric power water use for New England states. Winter and summer peaks in thermoelectric power water use reflect high electricity demand for heating and cooling.
Note that thermoelectric power water use in figure 3 shows only withdrawals from freshwater for thermoelectric power. All of the New England states except Vermont also have at least 1 thermoelectric facility that withdraws saline water (not shown).
Crop irrigation uses less water in New England compared to public supply and thermoelectric power (fig. 4). As expected, most crop irrigation water use occurs in summer and is negligible in winter. Of the New England states, Maine and Massachusetts use the most water for crop irrigation. In Maine, the crop categories that use the most irrigation water are greenhouse, potatoes, and mixed vegetables (Gordon and others, 2018). Blueberries are also presumed to use a large amount of irrigation water in Maine (likely underreported in the Gordon irrigation survey). In Massachusetts, berries and vegetables account for the most irrigated acres (USDA, 2024).
Figures
*Note that the 3 water-use time-series figures have different y-axis scales.
Figure 1
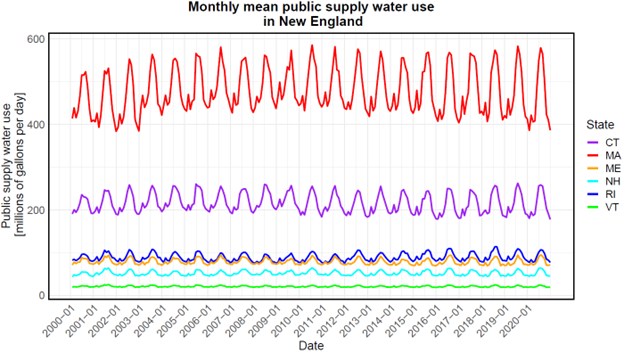
Figure 2

Figure 3
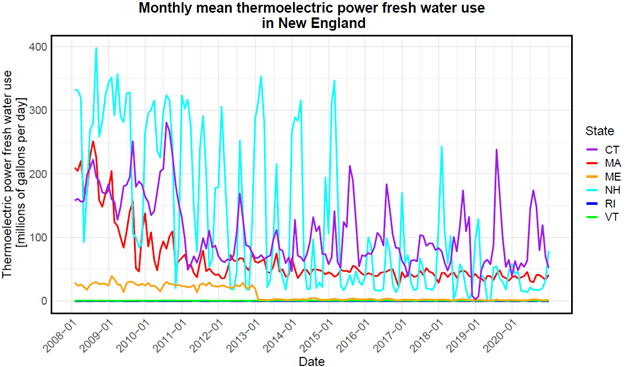
Figure 4

Definitions
Consumptive use‒The part of water withdrawn that is evaporated, transpired, incorporated in crops or products (examples are bottled water and other beverages), consumed by humans or livestock, or otherwise removed from the immediate water environment. Also referred to as water consumed.
HUC12‒small watersheds sized 50–100 square kilometers.
Irrigation water use‒As used in model estimates, irrigation water use is defined as water that is applied by an irrigation system to assist crop and pasture growth and includes water losses from irrigation systems and conveyance losses.
Public supply water use‒Water deliveries from public suppliers are used by domestic, commercial, industrial, thermoelectric power customers who do not have on-site sources of water, and for public water uses.
Thermoelectric power water use‒Water used in the process of generating electricity with stream-driven turbine generators.
References
Alzraiee, A., Niswonger, R., Luukkonen, C., Larsen, J., Martin, D., Herbert, D., Buchwald, C., Dieter, C., Miller, L., Stewart, J., Houston, N., Paulinski, S., Valseth, K, 2024, Next generation public supply water withdrawal estimation for the conterminous United States using machine learning and operational frameworks: Water Resources Research, 60, 25 p., accessed July 25, 2024, at https://doi.org/10.1029/ 2023WR036632.
Gordon, R.P., Whittaker, A.H., and Marvinney, R.G., 2018, Survey of Agricultural Water Users in Maine: Results for Calendar Year 2016: Maine Geological Survey, Circular 18-9., 40 p. accessed at https://digitalmaine.com/mgs_publications/539/.
Gorski, G.A., Stets, E., Scholl, M.A., Degnan, J.R., Mullaney, J.R., Galanter, A.E., Martinez, A.J., Padilla, J., LaFontaine, J.H., Corson-Dosch, H.R., and Shapiro, A.M., 2025, Water supply in the conterminous United States, Alaska, Hawaii, and Puerto Rico, water years 2010–20, chap. B of U.S. Geological Survey integrated water availability assessment—2010–20: U.S. Geological Survey Professional Paper 1894–B, 60 p., https://doi.org/10.3133/pp1894B.
Harris, M.A., Diehl, T.H., Gorman-Sanisaca, L.E., Galanter, A.E., Lombard, M.A., Skinner, K.D., Chamberlin, C., McCarthy, B.A., Niswonger, R., Stewart, J.S., and Valseth, K.J., 2025, Automating physics-based models to estimate thermoelectric-power water use: Environmental Modelling & Software, accessed January 8, 2025, at https://doi.org/ 10.1016/j.envsoft.2024.106265.
Stets, E., Cashman, M.J., Miller, O.L., and Powlen, K.A., 2025b, Integrated water availability in the conterminous United States, 2010–20, chap. F of U.S. Geological Survey integrated water availability assessment—2010–20: U.S. Geological Survey Professional Paper 1894–F, 41 p., https://doi.org/ 10.3133/pp1894F.
USDA (United States Department of Agriculture), 2024, 2022 Census of Agriculture: Massachusetts State and County Data (Table 35), accessed at NICE ARG Census Publication Generator.
Related Information
-
Water Withdrawal, Use, and Return Flows by Providence Water from the Scituate Reservoir, Rhode Island Water Withdrawal, Use, and Return Flows by Providence Water from the Scituate Reservoir, Rhode Island
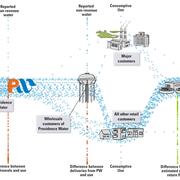
Water use is defined as how humans interact with the hydrologic cycle, and includes water withdrawal, delivery, consumptive use, wastewater release, and reclaimed wastewater. This schematic shows how these elements are interconnected.
Below are links to the USGS national water-use website and water-use web pages for the New England states.

Water Use in the United States
Below are FAQ related to water use.

Is saline water used for anything? Is saline water used for anything?
In the U.S., about 13 percent of all water used is saline water. But saline water can only be used for certain purposes. The main use is for thermoelectric power-plant cooling. About 5 percent of water used for industrial purposes is saline, and about 53 percent of all water used for mining purposes is saline. Saline water can be desalinated for use as drinking water by putting it through a...

How much natural water is there? How much natural water is there?
Earth is estimated to hold about 1,386,000,000 cubic kilometers of water. The breakdown of where all that water resides is estimated as follows: Oceans (saline) 1,338,000,000 cubic kilometers Ice caps and glaciers (fresh) 24,064,000 cubic kilometers Groundwater (fresh and saline) 23,400,000 cubic kilometers Streams, lakes, swamps (fresh) 104,590 cubic kilometers Lakes (saline) 85,400 cubic...

How much water is used by people in the United States? How much water is used by people in the United States?
Since 1950, the USGS has collected and analyzed water-use data for the United States and its Territories. That data is revised every 5 years. As of 2015, the United States uses 322 billion gallons of water per day (Bgal/day). The three largest water-use categories were irrigation (118 Bgal/day), thermoelectric power (133 Bgal/day), and public supply (39 Bgal/day), cumulatively accounting for 90...

What is the Earth's "water cycle?" What is the Earth's "water cycle?"
The water cycle, also known as the hydrologic cycle, describes where water is stored on Earth and how it moves. Water is stored in the atmosphere, on the land surface, and below the ground. It can be a liquid, a solid, or a gas. Liquid water can be fresh or saline (salty). Water moves between the places it is stored. It moves at large scales (through watersheds, the atmosphere, and below the Earth...
Monthly water use estimates for New England and the rest of the conterminous U.S. are now available for the three largest categories of use in the United States: public supply, crop irrigation, and thermoelectric power generation.
For public supply and crop irrigation, estimates are available for 2000 through 2020, and for thermoelectric power generation, estimates are available for 2008 through 2020.
These new estimates of water use and consumption, available at the small watershed scale (HUC12) and differentiated by groundwater and surface-water sources, were generated via machine learning data-driven models (links are below). Monthly estimates for 2020 for five additional categories of use, self-supplied industrial, domestic, mining, livestock, and aquaculture, are anticipated by the end of 2025.
Machine-learning estimates replace the U.S. Geological Survey’s previous “compiled snapshots” of the Nation's water-use data. Those previous snapshots were compiled at the county, State, and national levels (and intermittently at the regional watershed scale) every 5 years between 1950 and 2015. The latest (2015) report is available here.
- National Water Use Program: additional information about water use in the United States, including links to the data releases for the model estimates and reports describing methods of generating estimates and interpretive products.
- National Water Availability Assessment Data Companion: a server for monthly water-use model estimates for 2000 through 2020 for counties or HUC12s. A tutorial is provided that explains how to download estimates by state.
- USGS Integrated Water Availability Assessments: a status report on water availability for the conterminous U.S. for 2010-20, including chapter D, which is specific to water use.
New England Water-Use Estimates and Interpretive Products
- A predictive analysis of water demand for Providence, Rhode Island.
- Estimating domestic self-supplied water use in Rhode Island, 2014-21.
- Assessment of factors that influence human water demand for Providence, Rhode Island.
- Geonarrative about New England water use, 2015.
- Estimated water withdrawals and return flows in Vermont in 2005 and 2020.
Water Use in New England
For most New England states, public supply is consistently the largest category of freshwater water use. Public supply shows relatively consistent annual water use between 2000 and 2020 with a distinct seasonal component (fig. 1). More water is used in summer compared to winter for activities such as lawn and garden watering, filling swimming pools, and washing vehicles.
Because public supply water use is largely (although not completely) a function of population (Alzraiee and others, 2024), Massachusetts and Connecticut, with the largest populations in New England, use the largest volumes of water for public supply. The population of New England as a whole has seen only moderate growth (6 percent) between 2000 and 2020 (fig. 2). The largest increase was seen in Massachusetts (650,000 people) and the largest percent increase was seen in New Hampshire (13 percent).
Water use for thermoelectric power generation shows wide variability over time and among New England states (fig. 3). New Hampshire, Connecticut, Massachusetts, and Maine have experienced notable reductions in water use for thermoelectric power that begin variously between 2008 and 2015 and continue through 2020. Decreases can be attributed to an overall decline in the number of facilities as conventional and coal-fired plants have been retired (Harris and others, 2025). Figure 3 also shows substantial intra-annual variability in thermoelectric power water use for New England states. Winter and summer peaks in thermoelectric power water use reflect high electricity demand for heating and cooling.
Note that thermoelectric power water use in figure 3 shows only withdrawals from freshwater for thermoelectric power. All of the New England states except Vermont also have at least 1 thermoelectric facility that withdraws saline water (not shown).
Crop irrigation uses less water in New England compared to public supply and thermoelectric power (fig. 4). As expected, most crop irrigation water use occurs in summer and is negligible in winter. Of the New England states, Maine and Massachusetts use the most water for crop irrigation. In Maine, the crop categories that use the most irrigation water are greenhouse, potatoes, and mixed vegetables (Gordon and others, 2018). Blueberries are also presumed to use a large amount of irrigation water in Maine (likely underreported in the Gordon irrigation survey). In Massachusetts, berries and vegetables account for the most irrigated acres (USDA, 2024).
Figures
*Note that the 3 water-use time-series figures have different y-axis scales.
Figure 1
Figure 2
Figure 3
Figure 4
Definitions
Consumptive use‒The part of water withdrawn that is evaporated, transpired, incorporated in crops or products (examples are bottled water and other beverages), consumed by humans or livestock, or otherwise removed from the immediate water environment. Also referred to as water consumed.
HUC12‒small watersheds sized 50–100 square kilometers.
Irrigation water use‒As used in model estimates, irrigation water use is defined as water that is applied by an irrigation system to assist crop and pasture growth and includes water losses from irrigation systems and conveyance losses.
Public supply water use‒Water deliveries from public suppliers are used by domestic, commercial, industrial, thermoelectric power customers who do not have on-site sources of water, and for public water uses.
Thermoelectric power water use‒Water used in the process of generating electricity with stream-driven turbine generators.
References
Alzraiee, A., Niswonger, R., Luukkonen, C., Larsen, J., Martin, D., Herbert, D., Buchwald, C., Dieter, C., Miller, L., Stewart, J., Houston, N., Paulinski, S., Valseth, K, 2024, Next generation public supply water withdrawal estimation for the conterminous United States using machine learning and operational frameworks: Water Resources Research, 60, 25 p., accessed July 25, 2024, at https://doi.org/10.1029/ 2023WR036632.
Gordon, R.P., Whittaker, A.H., and Marvinney, R.G., 2018, Survey of Agricultural Water Users in Maine: Results for Calendar Year 2016: Maine Geological Survey, Circular 18-9., 40 p. accessed at https://digitalmaine.com/mgs_publications/539/.
Gorski, G.A., Stets, E., Scholl, M.A., Degnan, J.R., Mullaney, J.R., Galanter, A.E., Martinez, A.J., Padilla, J., LaFontaine, J.H., Corson-Dosch, H.R., and Shapiro, A.M., 2025, Water supply in the conterminous United States, Alaska, Hawaii, and Puerto Rico, water years 2010–20, chap. B of U.S. Geological Survey integrated water availability assessment—2010–20: U.S. Geological Survey Professional Paper 1894–B, 60 p., https://doi.org/10.3133/pp1894B.
Harris, M.A., Diehl, T.H., Gorman-Sanisaca, L.E., Galanter, A.E., Lombard, M.A., Skinner, K.D., Chamberlin, C., McCarthy, B.A., Niswonger, R., Stewart, J.S., and Valseth, K.J., 2025, Automating physics-based models to estimate thermoelectric-power water use: Environmental Modelling & Software, accessed January 8, 2025, at https://doi.org/ 10.1016/j.envsoft.2024.106265.
Stets, E., Cashman, M.J., Miller, O.L., and Powlen, K.A., 2025b, Integrated water availability in the conterminous United States, 2010–20, chap. F of U.S. Geological Survey integrated water availability assessment—2010–20: U.S. Geological Survey Professional Paper 1894–F, 41 p., https://doi.org/ 10.3133/pp1894F.
USDA (United States Department of Agriculture), 2024, 2022 Census of Agriculture: Massachusetts State and County Data (Table 35), accessed at NICE ARG Census Publication Generator.
Related Information
-
-
Water Withdrawal, Use, and Return Flows by Providence Water from the Scituate Reservoir, Rhode Island Water Withdrawal, Use, and Return Flows by Providence Water from the Scituate Reservoir, Rhode Island
Water use is defined as how humans interact with the hydrologic cycle, and includes water withdrawal, delivery, consumptive use, wastewater release, and reclaimed wastewater. This schematic shows how these elements are interconnected.
Below are links to the USGS national water-use website and water-use web pages for the New England states.
Water Use in the United States
Below are FAQ related to water use.
Is saline water used for anything? Is saline water used for anything?
In the U.S., about 13 percent of all water used is saline water. But saline water can only be used for certain purposes. The main use is for thermoelectric power-plant cooling. About 5 percent of water used for industrial purposes is saline, and about 53 percent of all water used for mining purposes is saline. Saline water can be desalinated for use as drinking water by putting it through a...
How much natural water is there? How much natural water is there?
Earth is estimated to hold about 1,386,000,000 cubic kilometers of water. The breakdown of where all that water resides is estimated as follows: Oceans (saline) 1,338,000,000 cubic kilometers Ice caps and glaciers (fresh) 24,064,000 cubic kilometers Groundwater (fresh and saline) 23,400,000 cubic kilometers Streams, lakes, swamps (fresh) 104,590 cubic kilometers Lakes (saline) 85,400 cubic...
How much water is used by people in the United States? How much water is used by people in the United States?
Since 1950, the USGS has collected and analyzed water-use data for the United States and its Territories. That data is revised every 5 years. As of 2015, the United States uses 322 billion gallons of water per day (Bgal/day). The three largest water-use categories were irrigation (118 Bgal/day), thermoelectric power (133 Bgal/day), and public supply (39 Bgal/day), cumulatively accounting for 90...
What is the Earth's "water cycle?" What is the Earth's "water cycle?"
The water cycle, also known as the hydrologic cycle, describes where water is stored on Earth and how it moves. Water is stored in the atmosphere, on the land surface, and below the ground. It can be a liquid, a solid, or a gas. Liquid water can be fresh or saline (salty). Water moves between the places it is stored. It moves at large scales (through watersheds, the atmosphere, and below the Earth...