
NHM: simulated runoff for April through June, 2011
By Water Resources Mission Area
January 2019 (approx.)

Detailed Description
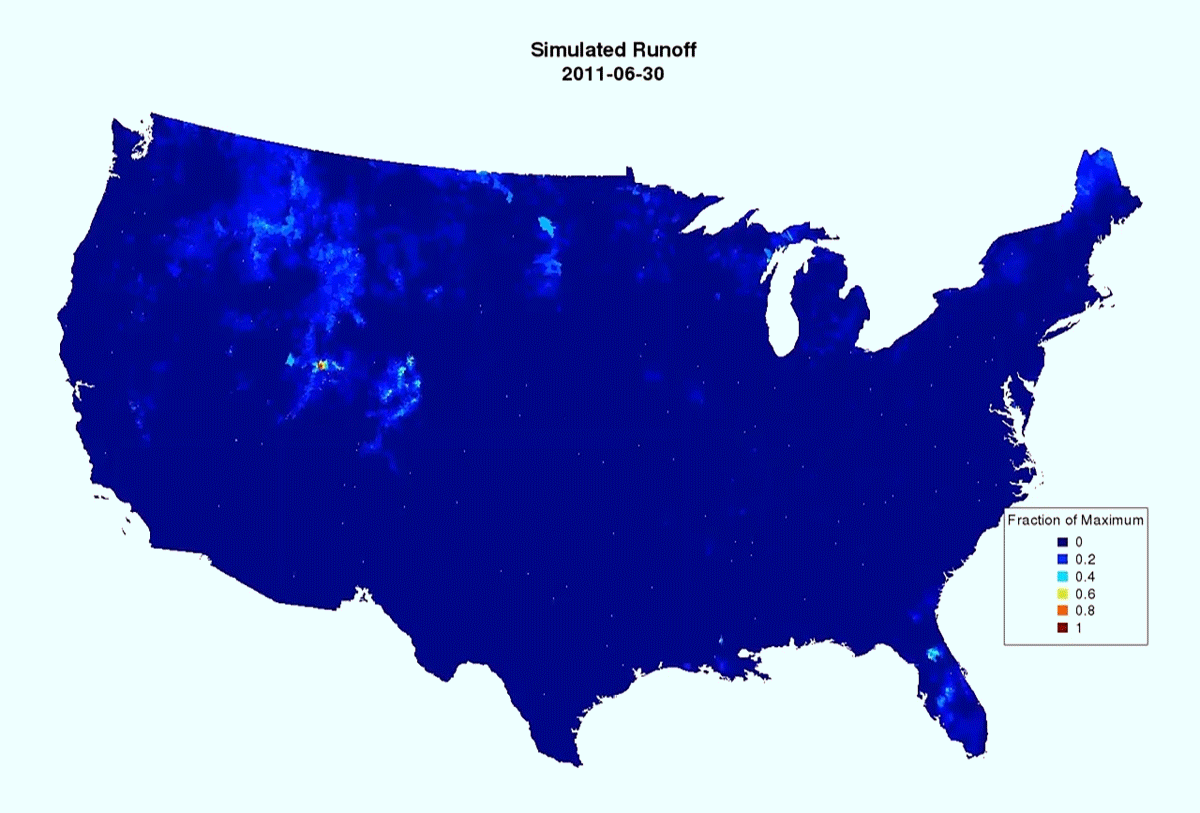
Animation of lateral flow to the stream network from each hydrologic response unit (HRU) normalized by maximum of the simulated time series of lateral flow from the Precipitation-Runoff Modeling System (PRMS) as implemented in the U.S. Geological Survey National Hydrologic Model (NHM) infrastructure. This animation covers the period of April through June 2011, during the historic Mississippi floods. Access an animation showing a longer time period here, released as part of this publication.
Sources/Usage
Public Domain.