
Nontidal Network Map 2023
Detailed Description
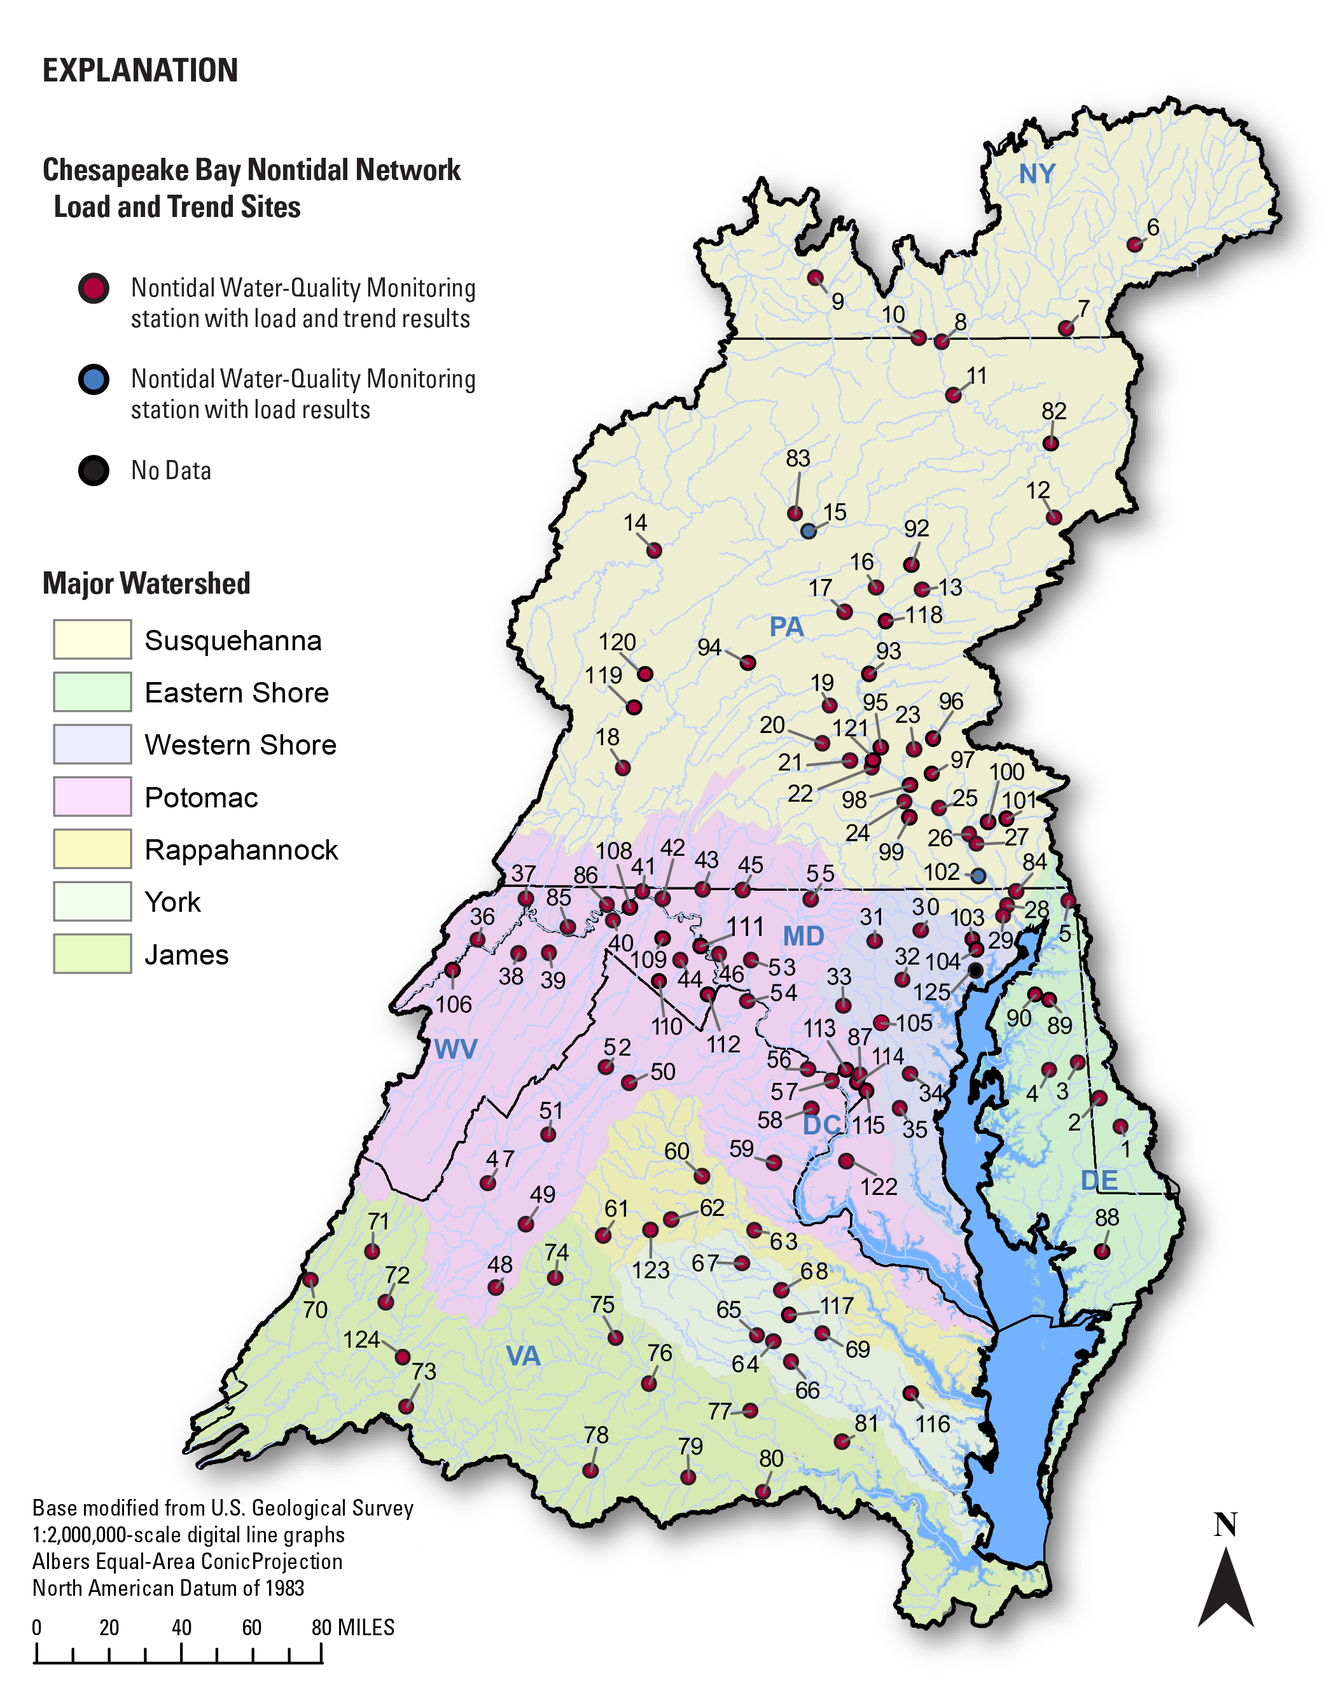
A map of the Chesapeake Bay watershed showing the distribution of nontidal network (NTN) stations as of 2023. The NTN comprises 123 monitoring stations throughout the Chesapeake Bay watershed where nutrients and sediment are collected monthly and during storms. The network is a cooperative effort by USGS, the U.S. Environmental Protection Agency (USEPA), and agencies in the states of the Chesapeake watershed and the District of Columbia.
For information on which station corresponds to which number on the map, click here.
Sources/Usage
Public Domain.
Related

Chesapeake Bay Water-Quality Loads and Trends
Access the most recent data gathered from the Chesapeake Bay Nontidal Monitoring Network, learn about the techniques used to collect this data, and read about the history of the Chesapeake Bay Nontidal Monitoring Program. Nontidal Network (NTN) data refers to data from the 123 monitoring stations where nutrients and sediment are collected monthly and during storms. River Input Monitoring (RIM)...
Related
Chesapeake Bay Water-Quality Loads and Trends
Access the most recent data gathered from the Chesapeake Bay Nontidal Monitoring Network, learn about the techniques used to collect this data, and read about the history of the Chesapeake Bay Nontidal Monitoring Program. Nontidal Network (NTN) data refers to data from the 123 monitoring stations where nutrients and sediment are collected monthly and during storms. River Input Monitoring (RIM)...