
Summer 2025 Newsletter - In The Flow
In this Summer 2025 edition: Western Maryland Flooding • Chesapeake Bay Watershed Loads & Trends • New Gages • New Publications
USGS surveys flooding in Western Maryland
The U.S. Geological Survey (USGS) was on the scene in Western Maryland to collect water data during and after the flooding caused by several inches of rain. Quantifying floods is vital for planning infrastructure that can withstand such extremes in the future.
As the flooding occurred, USGS crews traversed the area, collecting high flow measurements at over two dozen locations in Garrett, Allegany, and Washington counties. The job was challenging as certain roads were difficult or impossible to pass due to flooding.
USGS crews also attempted to measure high flow at Georges Creek, which was at the epicenter of flooding in the town of Westernport, Maryland, and near the site of the school evacuation, but it was too dangerous. Our crew returned when it was safer to collect two streamflow measurements while flows were still elevated, and then later when flooding subsided, identified high-water marks to estimate the volume of water during the peak of the flood.
Days later, evidence of the damage caused by the flood were visible throughout Westernport and across towns in the area, including at Georges Creek, where flooding caused the ground to collapse beneath an unused train line, leaving rails that were twisted mid-air and dangling for several dozen yards, yet somehow still connected on the other side.
Latest water quality loads and trends for Chesapeake Bay watershed published
By David Fisher, Public Affairs Specialist, and Alex Soroka, Physical Scientist

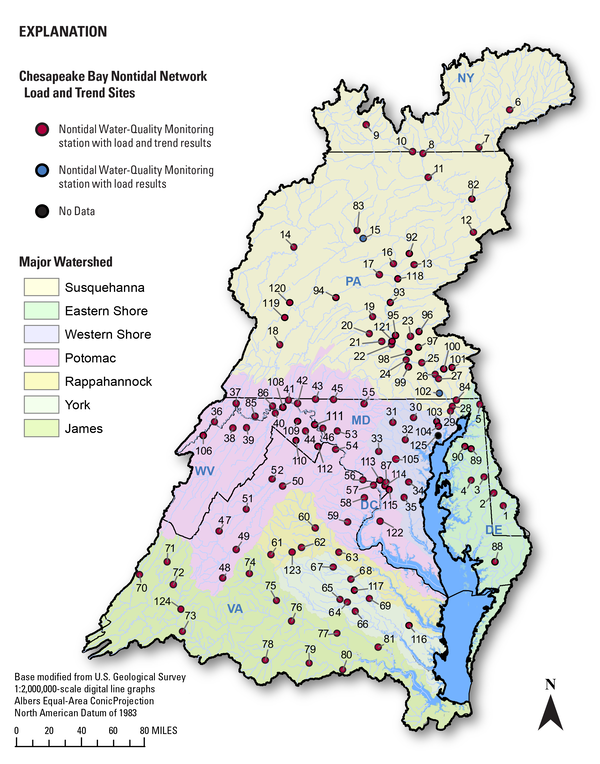
The U.S. Geological Survey (USGS) recently published flow-normalized trends in loads of nitrogen, phosphorus, and suspended sediment for the Chesapeake Bay Watershed from water years 1985 through 2023. This monitoring-based information provides federal, state, and local managers with accurate and timely information about the health of streams and rivers entering the Bay.
Understanding changes in the 64,000 square mile Chesapeake Bay watershed is critical to understanding the health of the Bay. States in the Bay watershed recognized this and in 2004 they formed the Non-Tidal Network (NTN), a collection of 123 monitoring stations that follow standard sampling protocols and analysis methods.
Spanning six states from New York to Virginia, as well as the District of Columbia, the consistency of the NTN provides accurate information on conditions and changes in water quality.
This is no small task and is only possible through teamwork from local, state, and federal partners who collect and analyze information from the 123 NTN stations. The total NTN dataset has over 51,000 samples -- that’s about 3.5 samples collected every single day since 1985! The USGS plays a critical role in the NTN, providing information on how much water is flowing at the gages, collecting samples, and analyzing load and trend results.
But the data doesn't collect itself. It takes dedicated people from federal, state, and local partner agencies, including the USGS, to sample all 123 stations routinely.
On a chilly morning in early March 2024, Kelly McVicker and Shane Mizelle, two hydrologic technicians from the USGS, made their way out to the catwalk of the Conowingo Dam to collect water samples after a storm.
Over the next hour, they repeatedly lowered a sampling bottle into the turbid, roaring waters some several dozen feet below, bringing it back up and transferring it to a larger container. They repeated this procedure at multiple points along the wide river to ensure that the sample would represent the conditions of the river at that particular point in time.
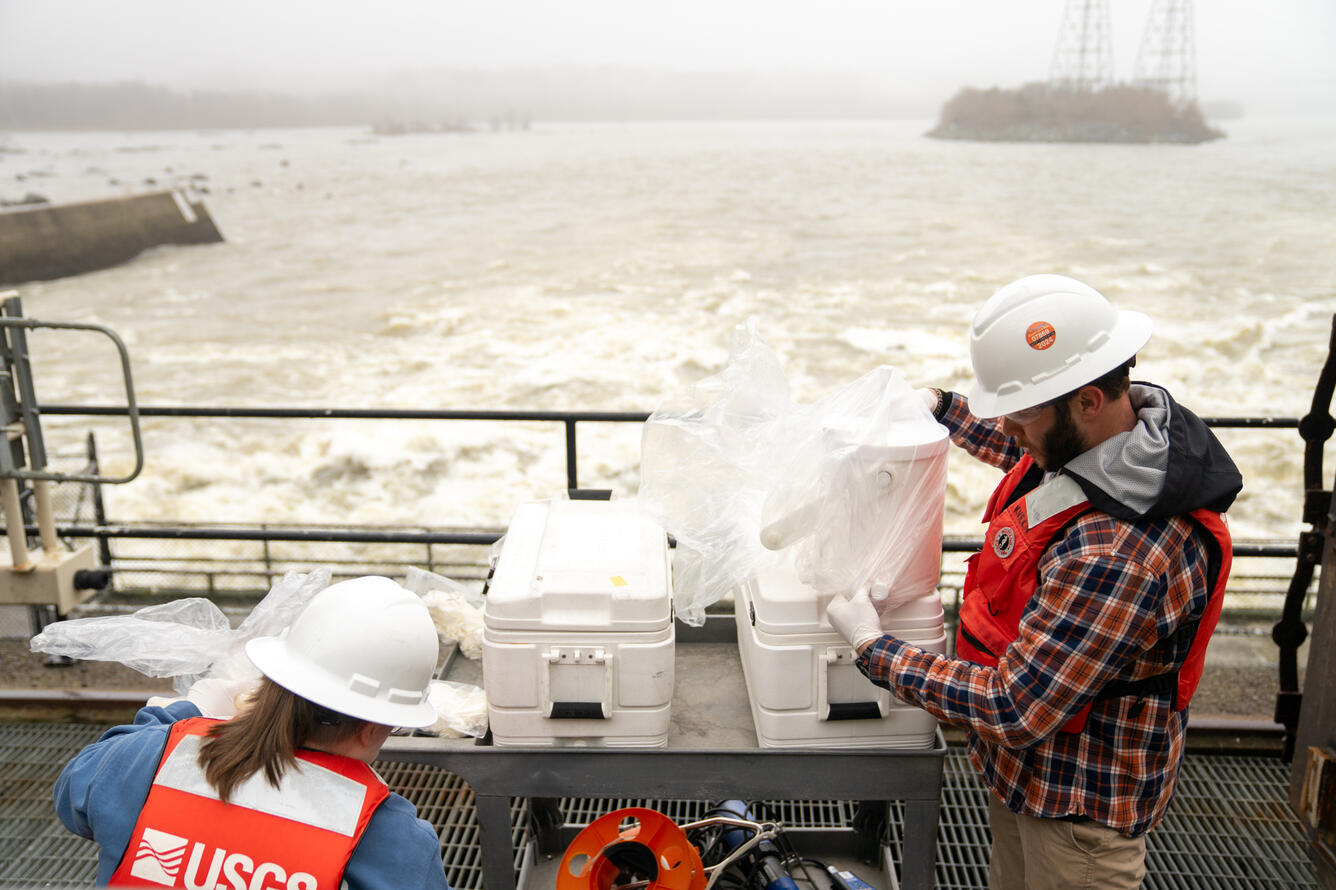
Month after month, and sometimes more frequently as dictated by storms, technicians from the USGS and other agencies repeat this process across 123 stations. In each instance the technicians follow consistent sampling collection, storage and analysis to allow for comparison over the entire network.
After the field, the samples are shipped to laboratories and analyzed, and laboratory staff run quality assurance tests.
Next, the data are returned to the collecting agencies and reviewed by their staff. If the data are approved and nothing is out of line, they are submitted to the Chesapeake Environmental Data Repository where the data are reviewed before inclusion.
Now, nutrient and sediment loads and trends can be calculated from the data.
USGS scientists use a statistical method known as Weighted Regressions on Time, Discharge and Season (WRTDS) to compute the flow-normalized load of nutrients and sediment at each station for each year the data are available. A station can have a load computed after 5 years of data, and after 10 years, the scientists will run a trend analysis to determine if the load is increasing, decreasing, or has no discernable trend.
The results computed at the 123 stations include trends in suspended sediment and total and dissolved nitrogen and phosphorus. Each year’s results are compared against the historic record to ensure a consistent dataset is used.

Following the load and trend analyses, the data are published in a data release, updated on a website and the results are distributed to NTN partners and other Chesapeake Bay stakeholders.
This tremendous effort would not be possible without the support of local and state governments and non-profits across the Chesapeake region.
🔗 VISIT THE NON-TIDAL NETWORK GEONARRATIVE || DIVE INTO THE DATA RELEASE || READ MORE ABOUT THE DATA RELEASE
USGS installs three temporary groundwater stations to monitor drought conditions in Delaware
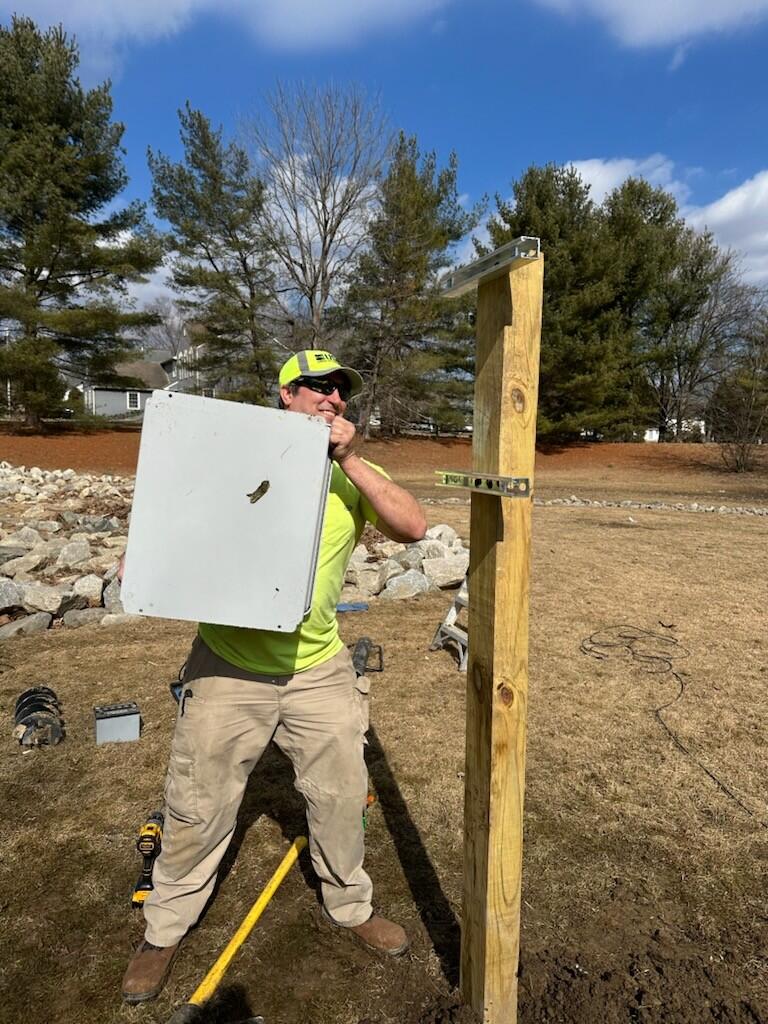
The U.S. Geological Survey installed groundwater stations in three locations across the state to monitor groundwater levels, doubling the number of active groundwater stations in Delaware operated by USGS from 3 to 6.
Until June 2025, Delaware was in a state of drought according to the U.S. Drought Monitor, and these sites were selected with the help of the Delaware Geological Survey to track groundwater levels throughout the state.
Monitoring at these sites will continue through at least September 30, 2025.
Funding was provided through the USGS Next Generation Water Observing System program (NGWOS) in response to drought conditions that had persisted since last summer.
View data from these sites, DE-Cb12-10, DE-Gb55-08, DE-Ng11-37.
Additional Updates to our Water Monitoring Network
This Winter and Spring we added the following sites to our monitoring network:
- Piscataway Creek at Joint Base Andrews, MD (01653521): Gage height, specific conductance, temperature, and turbidity.
- Piscataway Creek Tributary at Joint Base Andrews, MD (01653522): Gage height, specific conductance, temperature, and turbidity.
We also added HIVIS cameras to the following sites:
- Whitemarsh Run at White Marsh, MD (01585100)
- Mattawoman Creek Near Pomonkey, MD (01658000)
- Beaverdam Creek Near Cheverly, MD (01651730)
- Watts Branch at Washington, DC (01651800)
Reductions to Data Collection at a Handful of Monitoring Sites
Given proposed budget cuts from a cooperating agency, we foresee the following reductions to data collection at a handful of sites beginning on October 1, 2025. If there are questions concerning these sites, please email gs-w-mdtws_information@usgs.gov.
The following sites will be fully discontinued. Although historical data will remain accessible, no new data will be collected:
- Anacostia River at Kenilworth at Washington, DC (01651760): Continuous discharge water temperature, specific conductance, pH, dissolved oxygen, and turbidity.
- Anacostia River near Buzzard Point at Washington, DC (01651827): Continuous discharge, water temperature, specific conductance, and turbidity.
Watts Branch at Washington, DC (01651800) will lose its continuous discharge reporting, but all other continuous measurements will remain.
Discrete metals and bacteria water-quality analyses (cadmium, copper, lead, zinc, mercury, E. coli bacteria) at the following sites will be discontinued; however other water-quality parameters (phosphorus, nitrogen, and suspended sediment) will still be collected:
- Rock Creek at Joyce Road, Washington, DC (01648010)
- Hickey Run at National Arboretum at Washington, DC (01651770)
- Watts Branch at Washington, DC (01651800)
Stay Up-To-Date On Our Latest Science
These are the latest publications that our Center’s scientists contributed to: