Grab Our Data (and See Where We Work)
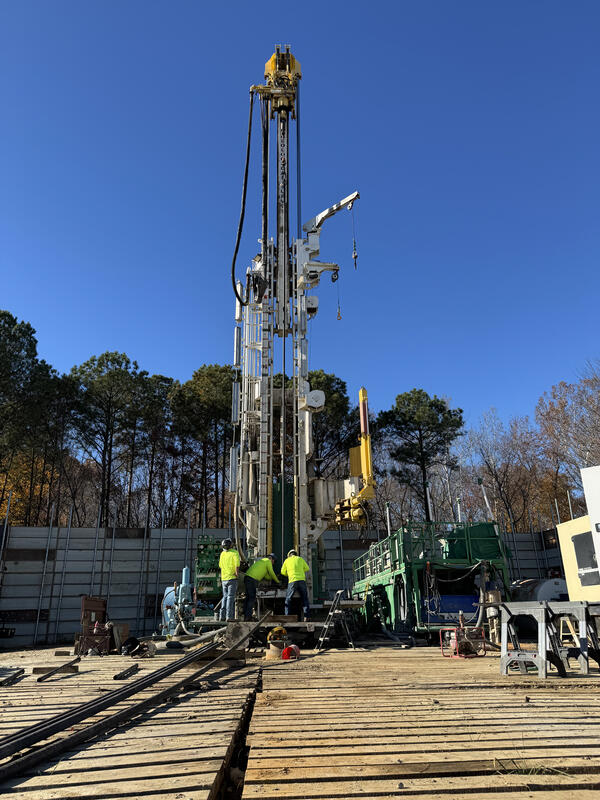
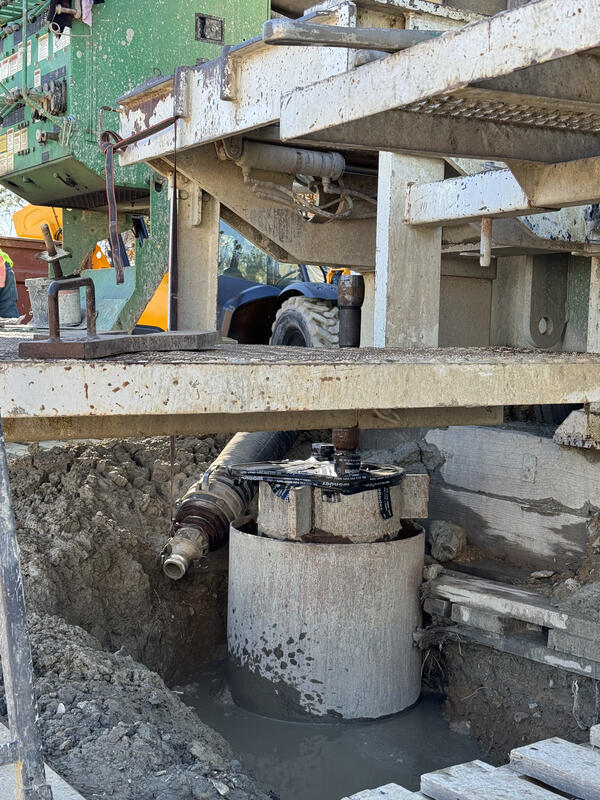
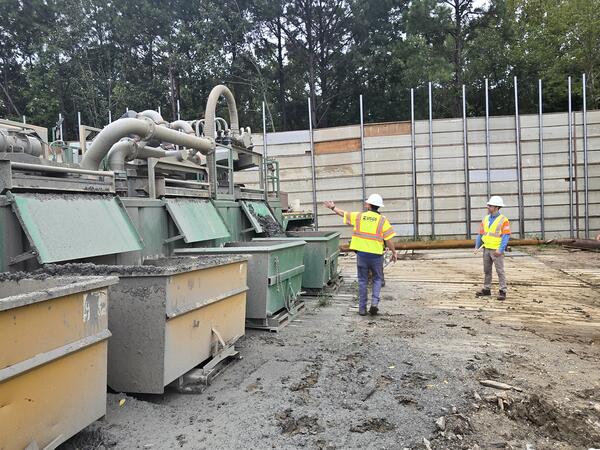
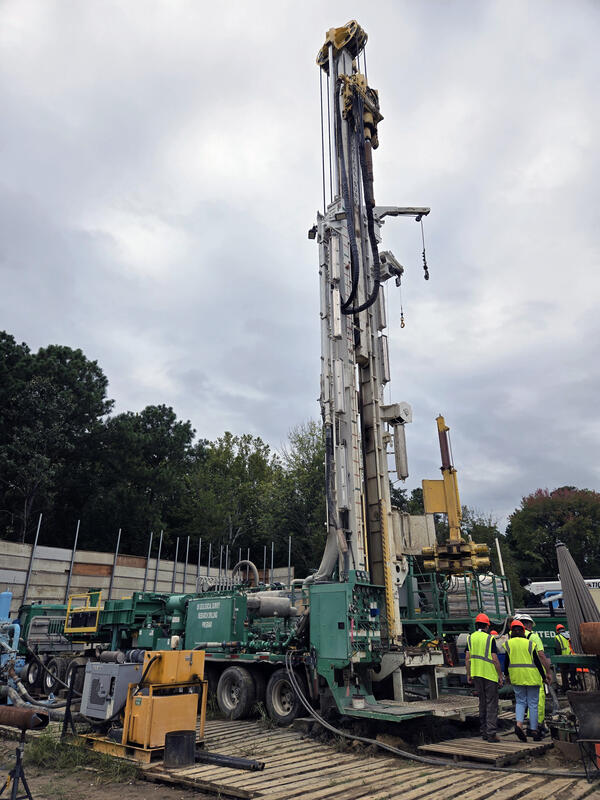
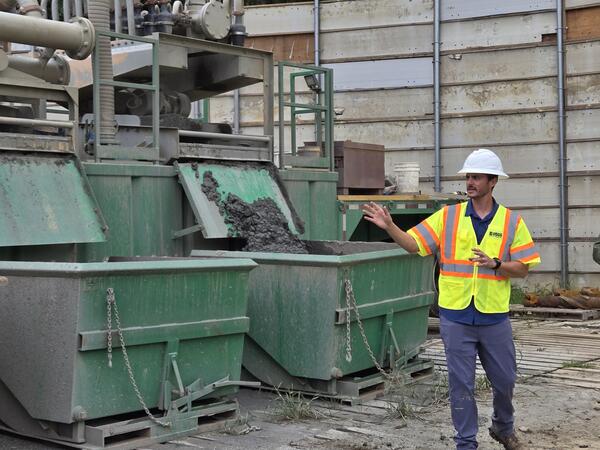
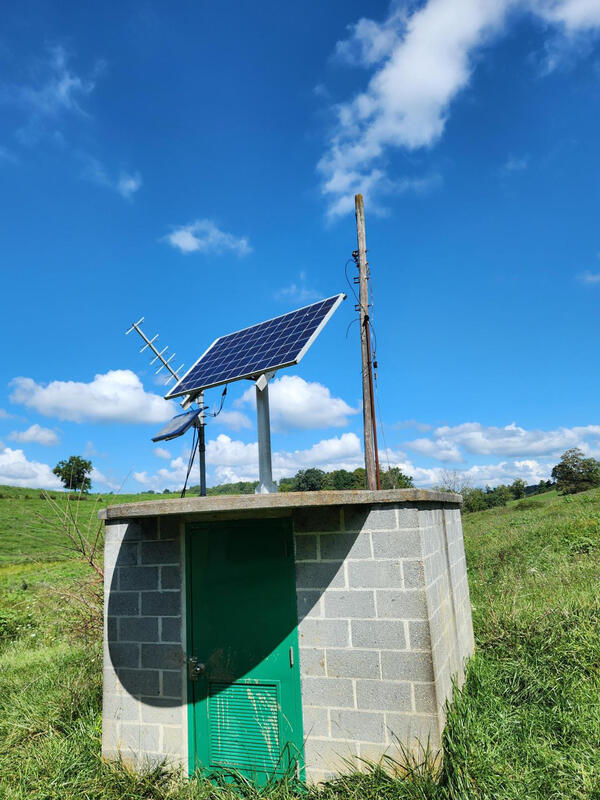
We operate and maintain extensive monitoring networks and conduct hydrologic investigations to quantify each component of the hydrologic cycle.
We operate and maintain extensive monitoring networks and conduct hydrologic investigations to quantify each component of the hydrologic cycle.
Nontidal Network Mapper Updates
The Nontidal Network Mapper has been updated with the latest short-term total nitrogen, total phosphorus, and suspended-sediment load and trend data for water years 2014 to 2023..
The Nontidal Network Mapper has been updated with the latest short-term total nitrogen, total phosphorus, and suspended-sediment load and trend data for water years 2014 to 2023..
Virginia and West Virginia Groundwater Levels and Trends
See current groundwater levels and trends at continuous groundwater wells across Virginia and West Virginia.
See current groundwater levels and trends at continuous groundwater wells across Virginia and West Virginia.
Explore Essential Tools and Products
Explore our scientific and data-driven web tools that include data visualizations, digital repositories, and interactive maps with data access and data analysis capabilities.
Explore our scientific and data-driven web tools that include data visualizations, digital repositories, and interactive maps with data access and data analysis capabilities.
Northeast Region Drought Streamflow Probabilities
Explore drought probabilities for select streams estimated using maximum likelihood regression. Winter streamflows are used to estimate the chance of hydrologic drought during summer months 5 to 11 months in advance.
Explore drought probabilities for select streams estimated using maximum likelihood regression. Winter streamflows are used to estimate the chance of hydrologic drought during summer months 5 to 11 months in advance.
Latest Worldwide Earthquakes detected by Virginia Well
2025 Eastern Kamchatka, Russia Earthquake causes water level fluctuations in Christiansburg, VA groundwater
2025 Eastern Kamchatka, Russia Earthquake causes water level fluctuations in Christiansburg, VA groundwater
Virginia and West Virginia Water Science Center
Welcome to the Virginia and West Virginia Water Science Center. We deliver timely and reliable data, advanced interpretive science, and tools needed to understand the water resources of Virginia and West Virginia in support of effective decision making.
Need assistance? Contact us through our Connect page.
Virginia Current Water Conditions
Virginia Current Water Conditions

Explore real-time Virginia streamflow, groundwater, and water-quality conditions and access data with our interactive map application.
West Virginia Current Water Conditions
West Virginia Current Water Conditions

Explore real-time West Virginia streamflow, groundwater, and water-quality conditions and access data with our interactive map application.
News
Study offers best picture yet of sinking land in the Chesapeake Bay region
Study offers best picture yet of sinking land in the Chesapeake Bay region
The Mystery of the Christiansburg Well
The Mystery of the Christiansburg Well
In West Point, Virginia, a New 'Subsidence Superstation' Measures Changing Land Surface
In West Point, Virginia, a New 'Subsidence Superstation' Measures Changing Land Surface
Publications
Ecosystem metabolism as an early warning indicator of lake algal blooms Ecosystem metabolism as an early warning indicator of lake algal blooms
Algal blooms represent ecosystem state shifts that degrade drinking water, restrict recreation, threaten public health, and lower property values. Detecting blooms in advance on management relevant timescales of days to weeks can support proactive intervention. Early warning statistics derived from indicator time series offer a framework for detecting state shifts, but the use of lake...
Estimation, distribution, and development of a surrogate model for Escherichia coli in the New River, New River Gorge National Park and Preserve, West Virginia, 2021–23 Estimation, distribution, and development of a surrogate model for Escherichia coli in the New River, New River Gorge National Park and Preserve, West Virginia, 2021–23
The New River Gorge National Park and Preserve in West Virginia receives more than 1 million visitors each year, many of whom come to enjoy the New River, which is known for its whitewater recreation. However, most of the tributaries within the New River Gorge are impaired by fecal-coliform bacteria, which are at concentrations that may exceed recreational-contact standards, posing a...
Factors affecting benthic macroinvertebrate health in the City of Roanoke, Virginia, 2020–2023 Factors affecting benthic macroinvertebrate health in the City of Roanoke, Virginia, 2020–2023
Major waterways in the City of Roanoke (City) have failed to meet Virginia’s aquatic life designated use since 1996. Segments of the upper Roanoke River lack healthy benthic macroinvertebrate communities which prompted a total maximum daily load (TMDL) study by the Virginia Department of Environmental Quality (VDEQ) to identify the most probable stressor(s) causing the impairment. Excess...
Science
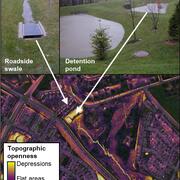
Remotely mapping stormwater facility footprints and storage volumes
Stormwater management practices are being used throughout the Chesapeake Bay watershed to reduce flood risks and pollutant loads, but consistent and comprehensive maps of these practices are often lacking. Stormwater managers often have incomplete information about the location and storage volume of stormwater facilities within their jurisdiction. Therefore, the USGS is working to develop...
Applying Multiple Tools to Inform Management of Per- and Polyfluoroalkyl Substances (PFAS) in the Potomac River Watershed
The reuse of municipal wastewater provides multiple benefits, including maintaining stream flow, recharging aquifers, and providing public water supply. However, along with the benefits are concerns related to the presence of ‘forever’ chemicals, like per- and polyfluoroalkyl substances (PFAS) in wastewater discharge. Managing PFAS in waterways is challenging because there are many potential PFAS...

Informing Chesapeake Bay Watershed Management by Monitoring Trends in River Nutrient and Sediment Loads
The USGS has computed nutrient and suspended-sediment loads and trends through water year 2023 in Chesapeake Bay rivers. These monitoring-based estimates help federal, state, and local managers evaluate and plan water-quality restoration strategies.