
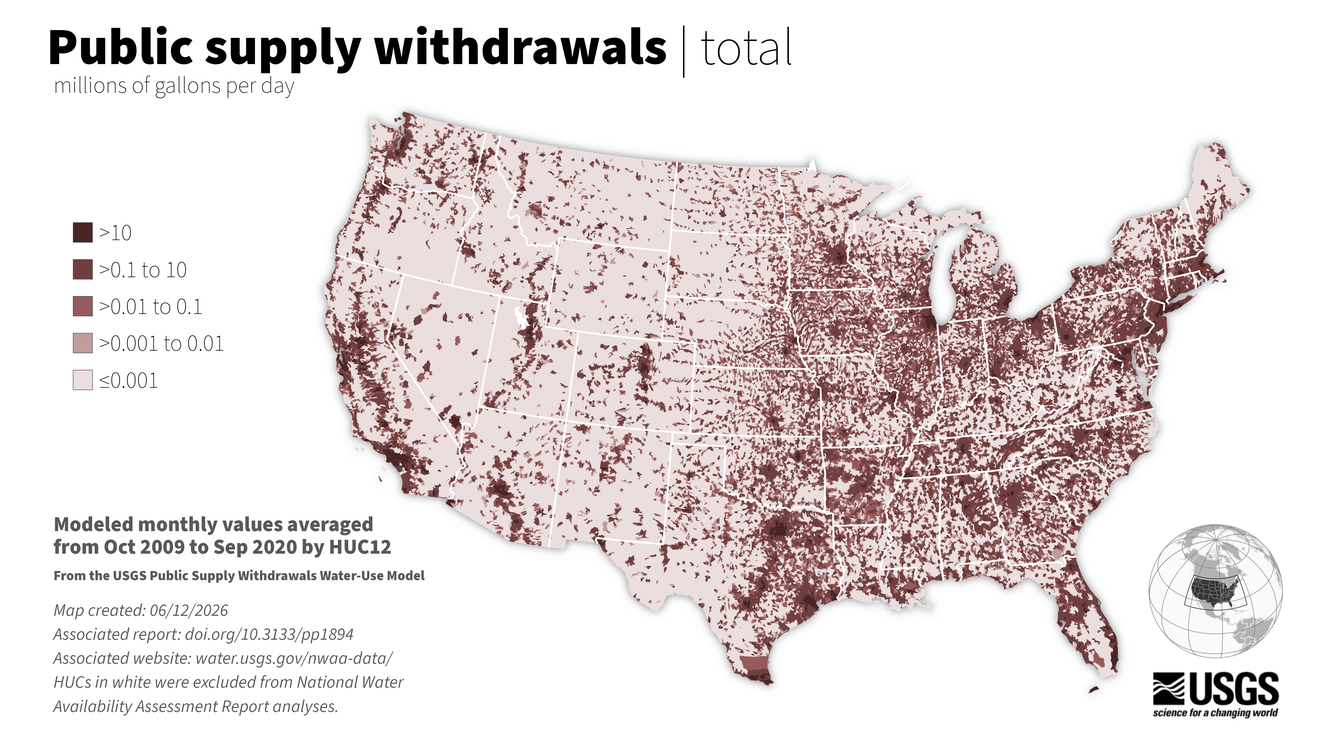
Public Supply Water Use map, monthly averages 2009-2020 by watershed
Detailed Description
This model computes the amount of water withdrawn for public supply each month over the period from 2000 to 2020 for all subwatersheds (12-digit Hydrologic Unit Codes or HUC12s) in the conterminous United States (CONUS).
This machine-learning model combines reported historical information with an array of different hydroclimatic, demographic, socioeconomic, geographic, and land use factors to compute public supply withdrawals across CONUS. Public supply is defined as water volumes withdrawn by public and private water suppliers that provide water to at least 25 people or have a minimum of 15 connections for at least 60 days. An estimated 283 million people (87% of the total population of the United States) relied on public supply water for household use in 2015 (Dieter et al., 2018). Public supply water is also used in some service areas for other purposes, such as commercial, thermoelectric, irrigation, and industrial activities that when combined can total 40 percent of public-supply deliveries (Dieter et al., 2018).
Published through the National Water Availability Assessment Data Companion.
Sources/Usage
Public Domain.
Related
Related science pages

Water Use in the United States

Accessing Water Use Data

National Water Availability Assessments
National Water Availability Assessment: Key Findings

National Water Availability Assessment Reports

National Water Availability Assessment Data Companion

Public Supply Water Use
Related
Related science pages
Water Use in the United States
Accessing Water Use Data
National Water Availability Assessments
National Water Availability Assessment: Key Findings
National Water Availability Assessment Reports
National Water Availability Assessment Data Companion