
Water Use in the United States
National Water Availability Assessment Data Companion
The USGS provides historic and recent water use data for the United States including the District of Columbia, Puerto Rico, and the U.S. Virgin Islands. This page provides an up-to-date guide to accessing, downloading, and using USGS water use data.
For more than 70 years, USGS has delivered national water‑use information that makes U.S. water demand visible, comparable, and understandable across sectors and regions. Through USGS Water Use Circulars published on 5-yr cycles, downloadable datasets, and tools like National Water Data Companion, the USGS has turned raw accounting of withdrawals and consumptive use into a long‑term, consistently organized record accessible knowledge for agencies, communities, and the public.
This page provides an overview of how and where to access USGS water use data, from the most recent datasets (2020) to the historic (1950-2015).
Categories of water use
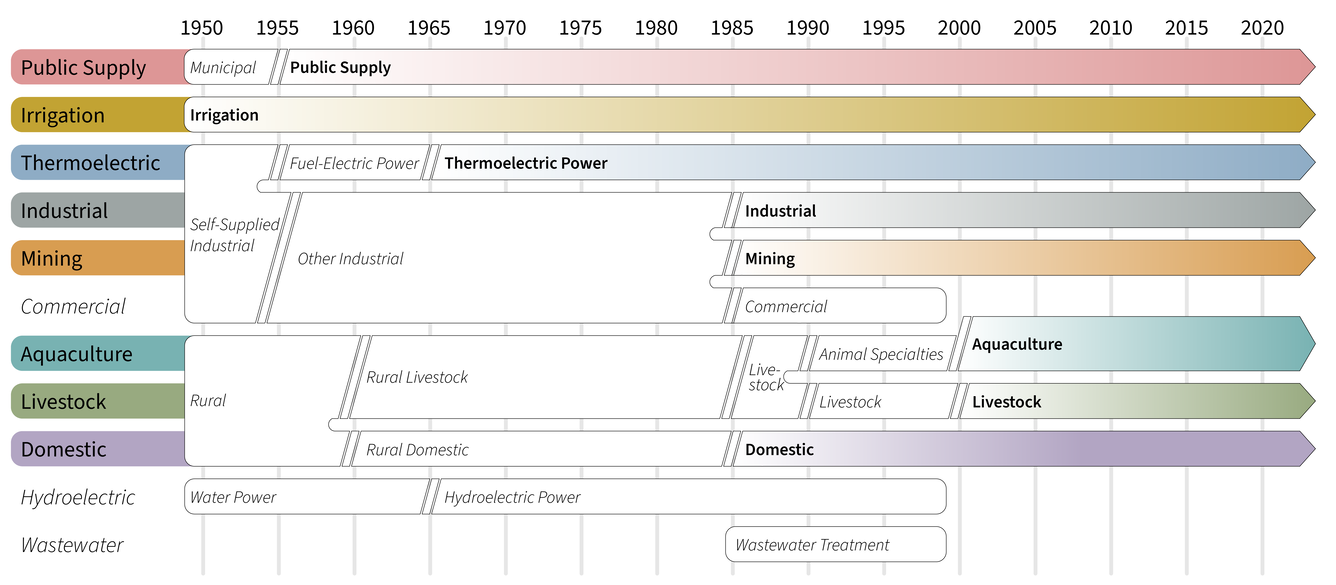
This diagram provides an overview of the categories of water use data that have been released through Circulars since 1950. For more information on the evolution of water use categories, view Changes in Water Use Categories. To learn more about Water Use in the United States and these categories, visit the USGS water use page.
Water Use Circulars from 1950 to 2015
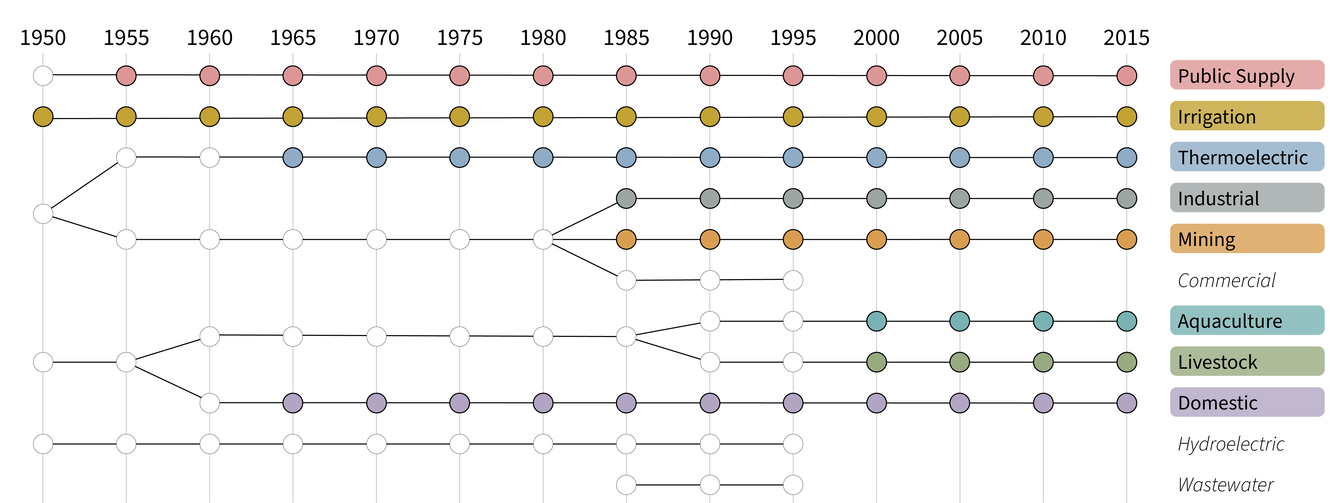
USGS Water Use Circulars have been published every five years from 1950 through 2015. The focus of most of these Circulars are water withdrawals from surface-water and groundwater sources. Consumptive use was also estimated from 1960 to 1995, and for several categories for 2010 and 2015. Consumptive use was also estimated for public supply, irrigation, and thermoelectric power in recent estimates ranging from 2000 to 2020.
This diagram shows the categories of water use that were included in the Circulars from 1950 through 2015. The hollow circles are categories or grouped categories that do not relate directly to data released in the latest Circular in 2015. For example, in 1950, self-supplied industrial included mining water use, but mining water use was not estimated directly until 1985.
Estimated use of water in the United States Circulars are available for the following years:
Water use estimates and analyses beyond 2015, including 2020, are available in several journal articles and in the National Water Availability Assessments (https://doi.org/10.3133/pp1894).
USGS Water Use Data Releases
The data published in support of the Water Use Circulars (pre-2020) are available through ScienceBase data releases. Modeled estimates of water use from 2000 to 2020 are available through the National Water Availability Data Companion and ScienceBase data releases.
Model-estimated Water Use Data
Monthly water use estimates for 2000 through 2020 are available for the three largest categories of use in the United States through the Data Companion. Read the Water Data Blog post to learn more about the Data Companion.
- Thermoelectric Power, which is available from 2009 through 2020
- Irrigation, which is available from 2000 through 2020
- Public Supply, which is available from 2000 through 2020
Data published through the Data Companion are provided in the following combinations:
- Spatial: The Data Companion delivers water use data by hydrologic unit, county, or state
- Time steps: The Data Companion delivers water use data at monthly, water year, or calendar year resolution
- Time span: The Data Companion delivers public supply and crop irrigation from 2000 through 2020 and thermoelectric water use from 2008 through 2020
- Fate of water: The Data Companion delivers water use data split into consumptive use versus withdrawals, with withdrawals representing the total water diverted for that use and consumptive use representing the portion of the withdrawal that is not returned to the environment and instead is evaporated to the atmosphere, consumed by humans or livestock, or incorporated into products or crops.
- Source of water: Water use data provided as a total amount or by source, including surface water or groundwater. Thermoelectric is also separated into saline versus freshwater.
The Data Companion will also include 2020 water use estimates for the remaining five categories (Industrial, Mining, Domestic, Livestock, and Aquaculture). In the meantime, these five categories will be released on ScienceBase by category:
- Domestic self-supplied water use estimates for 2020 have been published through ScienceBase (https://doi.org/10.5066/P13BILQT).
- The domestic water use estimates are complemented with a data release that synthesizes and subsets various groundwater well compilations into a unified domestic well database to standardize information on well characteristics and locations across the United States (https://doi.org/10.5066/P13JP4JQ).
- Industrial water use estimates for 2020 have been published through ScienceBase (https://doi.org/10.5066/P14WTLVD).
- Livestock water use estimates for 2023 have been published through ScienceBase (https://doi.org/10.5066/P1YUVSRN)
- The 2020 estimates for Mining and Aquaculture are scheduled to be released through ScienceBase in summer 2026 and eventually also available on the Data Companion.
1985 to 2015 Water Use Data
Aggregated water use data (county-level) from 1985 to 2015 are being re-released through a more consistent and comprehensive data release.
Some select historic water use estimates are available by year during this timeframe as well:
- 1985 to 2015: county-level data for Public Supply, Domestic, Irrigation, and Thermoelectric Power https://doi.org/10.5066/P9TA1DI9
- 2015: county-level data for Public Supply, Domestic, Irrigation, Thermoelectric Power, Industrial, Mining, Livestock, and Aquaculture https://doi.org/10.5066/F7TB15V5
- 2015: In addition, the top category of water-use by volume for each county was released for all eight categories (Public Supply, Domestic, Irrigation, Thermoelectric Power, Industrial, Mining, Livestock, and Aquaculture) on ScienceBase (https://doi.org/10.5066/P94Y93BW)
1950 to 1980 Water Use Data
Water use data available prior to 1985 are provided by state, with varying categories estimated depending on the year. These data are available on ScienceBase.
- 1950: State-level estimates of public supply, irrigation, and other industrial including thermoelectric power. All three categories have estimates of groundwater and surface water withdrawals, and thermoelectric also includes saline withdrawals.
- 1955: State-level estimates of public supply, irrigation, and other industrial including thermoelectric power and reclaimed wastewater. All three categories have estimates of groundwater and surface water withdrawals, and thermoelectric also includes saline withdrawals.
- 1960: State-level estimates of public supply, domestic, other industrial, total thermoelectric power, livestock, irrigation, and hydroelectric power. All categories include estimates for groundwater and surface water withdrawals as well as total consumptive use other than hydroelectric power.
- Public supply water use data are supplemented with population estimates, self-supplied withdrawals, and deliveries to domestic or commercial uses.
- Industrial water use data include saline withdrawal estimates and reclaimed wastewater.
- Total thermoelectric power water use data include saline withdrawal estimates.
- Irrigation water use data include conveyance loss, total irrigation in thousand acres, reclaimed wastewater related to irrigation, and total water delivered to farms.
- 1965: State-level estimates equivalent to 1960, but without estimates of the total water delivered to farms for irrigation water use.
- 1970: State-level estimates equivalent to 1965, but with saline consumptive use estimates for other industrial and thermoelectric power
- 1975: State-level estimates equivalent to 1970
- 1980: State-level estimates equivalent to 1970 and 1975
Related science

Water Use in the United States

Public Supply Water Use

Domestic Water Use

Irrigation Water Use

Thermoelectric Power Water Use

Industrial Water Use

Mining Water Use

Livestock Water Use

Aquaculture Water Use
The USGS provides historic and recent water use data for the United States including the District of Columbia, Puerto Rico, and the U.S. Virgin Islands. This page provides an up-to-date guide to accessing, downloading, and using USGS water use data.
For more than 70 years, USGS has delivered national water‑use information that makes U.S. water demand visible, comparable, and understandable across sectors and regions. Through USGS Water Use Circulars published on 5-yr cycles, downloadable datasets, and tools like National Water Data Companion, the USGS has turned raw accounting of withdrawals and consumptive use into a long‑term, consistently organized record accessible knowledge for agencies, communities, and the public.
This page provides an overview of how and where to access USGS water use data, from the most recent datasets (2020) to the historic (1950-2015).
Categories of water use
This diagram provides an overview of the categories of water use data that have been released through Circulars since 1950. For more information on the evolution of water use categories, view Changes in Water Use Categories. To learn more about Water Use in the United States and these categories, visit the USGS water use page.
Water Use Circulars from 1950 to 2015
USGS Water Use Circulars have been published every five years from 1950 through 2015. The focus of most of these Circulars are water withdrawals from surface-water and groundwater sources. Consumptive use was also estimated from 1960 to 1995, and for several categories for 2010 and 2015. Consumptive use was also estimated for public supply, irrigation, and thermoelectric power in recent estimates ranging from 2000 to 2020.
This diagram shows the categories of water use that were included in the Circulars from 1950 through 2015. The hollow circles are categories or grouped categories that do not relate directly to data released in the latest Circular in 2015. For example, in 1950, self-supplied industrial included mining water use, but mining water use was not estimated directly until 1985.
Estimated use of water in the United States Circulars are available for the following years:
Water use estimates and analyses beyond 2015, including 2020, are available in several journal articles and in the National Water Availability Assessments (https://doi.org/10.3133/pp1894).
USGS Water Use Data Releases
The data published in support of the Water Use Circulars (pre-2020) are available through ScienceBase data releases. Modeled estimates of water use from 2000 to 2020 are available through the National Water Availability Data Companion and ScienceBase data releases.
Model-estimated Water Use Data
Monthly water use estimates for 2000 through 2020 are available for the three largest categories of use in the United States through the Data Companion. Read the Water Data Blog post to learn more about the Data Companion.
- Thermoelectric Power, which is available from 2009 through 2020
- Irrigation, which is available from 2000 through 2020
- Public Supply, which is available from 2000 through 2020
Data published through the Data Companion are provided in the following combinations:
- Spatial: The Data Companion delivers water use data by hydrologic unit, county, or state
- Time steps: The Data Companion delivers water use data at monthly, water year, or calendar year resolution
- Time span: The Data Companion delivers public supply and crop irrigation from 2000 through 2020 and thermoelectric water use from 2008 through 2020
- Fate of water: The Data Companion delivers water use data split into consumptive use versus withdrawals, with withdrawals representing the total water diverted for that use and consumptive use representing the portion of the withdrawal that is not returned to the environment and instead is evaporated to the atmosphere, consumed by humans or livestock, or incorporated into products or crops.
- Source of water: Water use data provided as a total amount or by source, including surface water or groundwater. Thermoelectric is also separated into saline versus freshwater.
The Data Companion will also include 2020 water use estimates for the remaining five categories (Industrial, Mining, Domestic, Livestock, and Aquaculture). In the meantime, these five categories will be released on ScienceBase by category:
- Domestic self-supplied water use estimates for 2020 have been published through ScienceBase (https://doi.org/10.5066/P13BILQT).
- The domestic water use estimates are complemented with a data release that synthesizes and subsets various groundwater well compilations into a unified domestic well database to standardize information on well characteristics and locations across the United States (https://doi.org/10.5066/P13JP4JQ).
- Industrial water use estimates for 2020 have been published through ScienceBase (https://doi.org/10.5066/P14WTLVD).
- Livestock water use estimates for 2023 have been published through ScienceBase (https://doi.org/10.5066/P1YUVSRN)
- The 2020 estimates for Mining and Aquaculture are scheduled to be released through ScienceBase in summer 2026 and eventually also available on the Data Companion.
1985 to 2015 Water Use Data
Aggregated water use data (county-level) from 1985 to 2015 are being re-released through a more consistent and comprehensive data release.
Some select historic water use estimates are available by year during this timeframe as well:
- 1985 to 2015: county-level data for Public Supply, Domestic, Irrigation, and Thermoelectric Power https://doi.org/10.5066/P9TA1DI9
- 2015: county-level data for Public Supply, Domestic, Irrigation, Thermoelectric Power, Industrial, Mining, Livestock, and Aquaculture https://doi.org/10.5066/F7TB15V5
- 2015: In addition, the top category of water-use by volume for each county was released for all eight categories (Public Supply, Domestic, Irrigation, Thermoelectric Power, Industrial, Mining, Livestock, and Aquaculture) on ScienceBase (https://doi.org/10.5066/P94Y93BW)
1950 to 1980 Water Use Data
Water use data available prior to 1985 are provided by state, with varying categories estimated depending on the year. These data are available on ScienceBase.
- 1950: State-level estimates of public supply, irrigation, and other industrial including thermoelectric power. All three categories have estimates of groundwater and surface water withdrawals, and thermoelectric also includes saline withdrawals.
- 1955: State-level estimates of public supply, irrigation, and other industrial including thermoelectric power and reclaimed wastewater. All three categories have estimates of groundwater and surface water withdrawals, and thermoelectric also includes saline withdrawals.
- 1960: State-level estimates of public supply, domestic, other industrial, total thermoelectric power, livestock, irrigation, and hydroelectric power. All categories include estimates for groundwater and surface water withdrawals as well as total consumptive use other than hydroelectric power.
- Public supply water use data are supplemented with population estimates, self-supplied withdrawals, and deliveries to domestic or commercial uses.
- Industrial water use data include saline withdrawal estimates and reclaimed wastewater.
- Total thermoelectric power water use data include saline withdrawal estimates.
- Irrigation water use data include conveyance loss, total irrigation in thousand acres, reclaimed wastewater related to irrigation, and total water delivered to farms.
- 1965: State-level estimates equivalent to 1960, but without estimates of the total water delivered to farms for irrigation water use.
- 1970: State-level estimates equivalent to 1965, but with saline consumptive use estimates for other industrial and thermoelectric power
- 1975: State-level estimates equivalent to 1970
- 1980: State-level estimates equivalent to 1970 and 1975
Related science
Water Use in the United States
Public Supply Water Use
Domestic Water Use
Irrigation Water Use
Thermoelectric Power Water Use
Industrial Water Use
Mining Water Use
Livestock Water Use