
Since 1950, the USGS has regularly produced nationwide water‑use data, creating one of the most comprehensive pictures of how water is used across the United States. Building on this rich historical record, these data give water managers a critical foundation to evaluate long‑term trends, plan strategically, and identify and quantify water availability so they can design more adaptive, resilient water management strategies.
An understanding of where, when, why, and how much water is withdrawn for human use is fundamental to understanding the Nation's water availability.
USGS water use data are used to:
- Support long‑term water availability and security assessments by quantifying demand alongside supply.
- Inform state, regional, and basin planning (allocations, drought planning, interstate compacts, environmental flows) using comparable county, state, and national estimates.
- Provide standardized methods and categories that allow for water use patterns to be compared across regions and decades, which is critical for evaluating the effects of climate variability, land‑use change, technology, and policy.
More information about how water use data are used to understand and quantify national water availability can be found in the National Water Availability Assessment.
Water Use Research
Water Use Data
Educational Resources on Water Use
Categories of Water Use
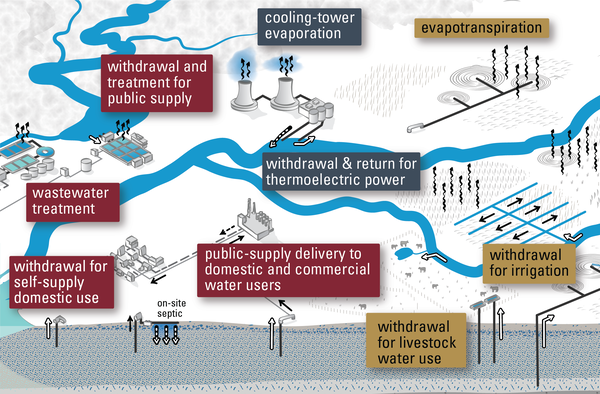
The USGS currently publishes water use data and information for eight categories of water use: public supply, irrigation, thermoelectric power, domestic self-supply, industry, aquaculture, livestock, and mining.
- Public Supply: Water withdrawn by public or private water suppliers that serve at least 25 people or have a minimum of 15 service connections. Public-supply water is distributed for domestic, commercial, and industrial uses.
- Irrigation: Water applied by an irrigation system to support plant growth in agricultural and horticultural practices.
- Thermoelectric Power: Water used in generating electricity with steam-driven turbine generators. Cooling water may be sourced from fresh or saline surface water and groundwater. Reclaimed wastewater is a supplemental source of water for thermoelectric power, especially in water-limited areas.
- Industrial: Water used for manufacturing purposes including fabricating, processing, washing, diluting, cooling, transporting products, or facility sanitation. Industries that produce commodities such as food, paper, chemicals, refined petroleum, or primary metals use large amounts of water. Water for industrial use may be self-supplied or delivered by public providers.
- Mining: Water used for the extraction of minerals in solid (for example, coal, iron, sand, and gravel), liquid (crude petroleum), and gas (natural gas) form. This includes quarrying, milling, injection of water for resource recovery (including hydraulic fracturing), and related activities.
- Domestic (self-supplied): Water withdrawn for residential use, typically from a private source, such as a well, or captured as rainwater in a cistern. Uses include drinking, food preparation, bathing, cleaning, sanitation, watering lawns and gardens, and maintaining pools. This quantity does not include water used residentially but supplied from public utilities, which is covered by the public supply category (above).
- Livestock: Water used for livestock operations, including animal consumption, feedlots, dairy production, facility cooling, sanitation, waste management, and other on-farm needs. Livestock includes cattle, sheep, goats, pigs, horses, and poultry.
- Aquaculture: Water used for raising aquatic organisms —such as finfish and shellfish—for food, restoration, conservation, or recreation. Aquaculture production typically occurs under controlled conditions in ponds, flow through raceways, and, to a lesser extent, cages, net pens, and closed-recirculation tanks.
The terminology around these water use categories and methods have changed through time to reflect improvements in estimation methods, data availability, and understanding of water-use dynamics. First published for the year 1950, the series of USGS Water Use Circulars were the first efforts at a complete picture of national water use. Since then, some categories have been renamed while retaining essentially the same definitions (e.g. public supply water use was first called municipal water use in the 1950s Circular). In other cases, categories have been split, or had components reassigned to better represent how water is used and reported on. Learn more about the evolution of these categories through time.
Withdrawals and Consumptive Use
Not all water withdrawn for human use is lost, much of it returns to the environment. Water that does not return to local water bodies or groundwater is called "consumptive use." Consumptive use includes water that evaporates into the atmosphere, is consumed by humans or livestock, or is incorporated into products or crops. USGS water use data include both total withdrawals and consumptive use estimates.
Sources of Water Use
Water withdrawn across the U.S. comes from two main sources: surface or groundwater. The amount of water withdrawn from surface versus groundwater depends on what is available, how it is being used, and local water laws and rights. For example, some thermoelectric power plants use saline surface water withdrawals for cooling, others use fresh surface or groundwater. USGS water use data are provided with both surface water and groundwater estimates and fresh versus saline estimates.
A New Age in National Water Use Modeling
The U.S. Geological Survey is developing new models to estimate water withdrawals and consumptive use. These models will use artificial intelligence/machine learning (AI/ML), replacing the previously used methods of compiling and reviewing available data. These AI/ML models will allow for more consistent and frequent reporting of water use information with an enhanced understanding of how water is used and what influences the variation in time and space. The models will be useful in identifying data gaps and data quality issues which in turn will inform data collection and ultimately improve future models focused on predictions. Explore the publications related to water use for more information.
Water Use Data Availability
Water use data are delivered through two primary means, depending on the year and category: The National Water Availability Data Companion and ScienceBase data releases. The Accessing Water Use Data page provides a detailed list and links to all the data available plus the original USGS Water Use Circulars.
2020 Water Use Data availability
Monthly water use estimates for 2000 through 2020 are available for the three largest categories of use in the United States through the Data Companion:
- Thermoelectric Power, which is available from 2009 through 2020
- Irrigation, which is available from 2000 through 2020
- Public Supply, which is available from 2000 through 2020
The Data Companion will also include 2020 water use estimates for the remaining five categories, which are being first released on ScienceBase (Industrial, Mining, Domestic, Livestock, and Aquaculture).
Historic (pre-2020) Water Use Data Availability
Historic water use estimates are available by year through ScienceBase. Visit the Accessing Water Use Data page for a detailed list and links to all the historic water use data.
Below are related water-use topics.

National Water Availability Assessment Data Companion

Accessing Water Use Data

National Water Availability Assessment: Key Findings

National Water Availability Assessment Reports

Total Water Use

Trends in Water Use

Surface-Water Use

Groundwater Use

Public Supply Water Use

Domestic Water Use

Irrigation Water Use

Thermoelectric Power Water Use

Industrial Water Use
Since 1950, the USGS has regularly produced nationwide water‑use data, creating one of the most comprehensive pictures of how water is used across the United States. Building on this rich historical record, these data give water managers a critical foundation to evaluate long‑term trends, plan strategically, and identify and quantify water availability so they can design more adaptive, resilient water management strategies.
An understanding of where, when, why, and how much water is withdrawn for human use is fundamental to understanding the Nation's water availability.
USGS water use data are used to:
- Support long‑term water availability and security assessments by quantifying demand alongside supply.
- Inform state, regional, and basin planning (allocations, drought planning, interstate compacts, environmental flows) using comparable county, state, and national estimates.
- Provide standardized methods and categories that allow for water use patterns to be compared across regions and decades, which is critical for evaluating the effects of climate variability, land‑use change, technology, and policy.
More information about how water use data are used to understand and quantify national water availability can be found in the National Water Availability Assessment.
Water Use Research
Water Use Data
Educational Resources on Water Use
Categories of Water Use
The USGS currently publishes water use data and information for eight categories of water use: public supply, irrigation, thermoelectric power, domestic self-supply, industry, aquaculture, livestock, and mining.
- Public Supply: Water withdrawn by public or private water suppliers that serve at least 25 people or have a minimum of 15 service connections. Public-supply water is distributed for domestic, commercial, and industrial uses.
- Irrigation: Water applied by an irrigation system to support plant growth in agricultural and horticultural practices.
- Thermoelectric Power: Water used in generating electricity with steam-driven turbine generators. Cooling water may be sourced from fresh or saline surface water and groundwater. Reclaimed wastewater is a supplemental source of water for thermoelectric power, especially in water-limited areas.
- Industrial: Water used for manufacturing purposes including fabricating, processing, washing, diluting, cooling, transporting products, or facility sanitation. Industries that produce commodities such as food, paper, chemicals, refined petroleum, or primary metals use large amounts of water. Water for industrial use may be self-supplied or delivered by public providers.
- Mining: Water used for the extraction of minerals in solid (for example, coal, iron, sand, and gravel), liquid (crude petroleum), and gas (natural gas) form. This includes quarrying, milling, injection of water for resource recovery (including hydraulic fracturing), and related activities.
- Domestic (self-supplied): Water withdrawn for residential use, typically from a private source, such as a well, or captured as rainwater in a cistern. Uses include drinking, food preparation, bathing, cleaning, sanitation, watering lawns and gardens, and maintaining pools. This quantity does not include water used residentially but supplied from public utilities, which is covered by the public supply category (above).
- Livestock: Water used for livestock operations, including animal consumption, feedlots, dairy production, facility cooling, sanitation, waste management, and other on-farm needs. Livestock includes cattle, sheep, goats, pigs, horses, and poultry.
- Aquaculture: Water used for raising aquatic organisms —such as finfish and shellfish—for food, restoration, conservation, or recreation. Aquaculture production typically occurs under controlled conditions in ponds, flow through raceways, and, to a lesser extent, cages, net pens, and closed-recirculation tanks.
The terminology around these water use categories and methods have changed through time to reflect improvements in estimation methods, data availability, and understanding of water-use dynamics. First published for the year 1950, the series of USGS Water Use Circulars were the first efforts at a complete picture of national water use. Since then, some categories have been renamed while retaining essentially the same definitions (e.g. public supply water use was first called municipal water use in the 1950s Circular). In other cases, categories have been split, or had components reassigned to better represent how water is used and reported on. Learn more about the evolution of these categories through time.
Withdrawals and Consumptive Use
Not all water withdrawn for human use is lost, much of it returns to the environment. Water that does not return to local water bodies or groundwater is called "consumptive use." Consumptive use includes water that evaporates into the atmosphere, is consumed by humans or livestock, or is incorporated into products or crops. USGS water use data include both total withdrawals and consumptive use estimates.
Sources of Water Use
Water withdrawn across the U.S. comes from two main sources: surface or groundwater. The amount of water withdrawn from surface versus groundwater depends on what is available, how it is being used, and local water laws and rights. For example, some thermoelectric power plants use saline surface water withdrawals for cooling, others use fresh surface or groundwater. USGS water use data are provided with both surface water and groundwater estimates and fresh versus saline estimates.
A New Age in National Water Use Modeling
The U.S. Geological Survey is developing new models to estimate water withdrawals and consumptive use. These models will use artificial intelligence/machine learning (AI/ML), replacing the previously used methods of compiling and reviewing available data. These AI/ML models will allow for more consistent and frequent reporting of water use information with an enhanced understanding of how water is used and what influences the variation in time and space. The models will be useful in identifying data gaps and data quality issues which in turn will inform data collection and ultimately improve future models focused on predictions. Explore the publications related to water use for more information.
Water Use Data Availability
Water use data are delivered through two primary means, depending on the year and category: The National Water Availability Data Companion and ScienceBase data releases. The Accessing Water Use Data page provides a detailed list and links to all the data available plus the original USGS Water Use Circulars.
2020 Water Use Data availability
Monthly water use estimates for 2000 through 2020 are available for the three largest categories of use in the United States through the Data Companion:
- Thermoelectric Power, which is available from 2009 through 2020
- Irrigation, which is available from 2000 through 2020
- Public Supply, which is available from 2000 through 2020
The Data Companion will also include 2020 water use estimates for the remaining five categories, which are being first released on ScienceBase (Industrial, Mining, Domestic, Livestock, and Aquaculture).
Historic (pre-2020) Water Use Data Availability
Historic water use estimates are available by year through ScienceBase. Visit the Accessing Water Use Data page for a detailed list and links to all the historic water use data.
Below are related water-use topics.
National Water Availability Assessment Data Companion
Accessing Water Use Data
National Water Availability Assessment: Key Findings
National Water Availability Assessment Reports
Total Water Use
Trends in Water Use
Surface-Water Use
Groundwater Use
Public Supply Water Use
Domestic Water Use
Irrigation Water Use
Thermoelectric Power Water Use