
Radar interferograms showing examples of linear subsidence features that occurred directly above recent dike intrusions in Hawaii

Detailed Description
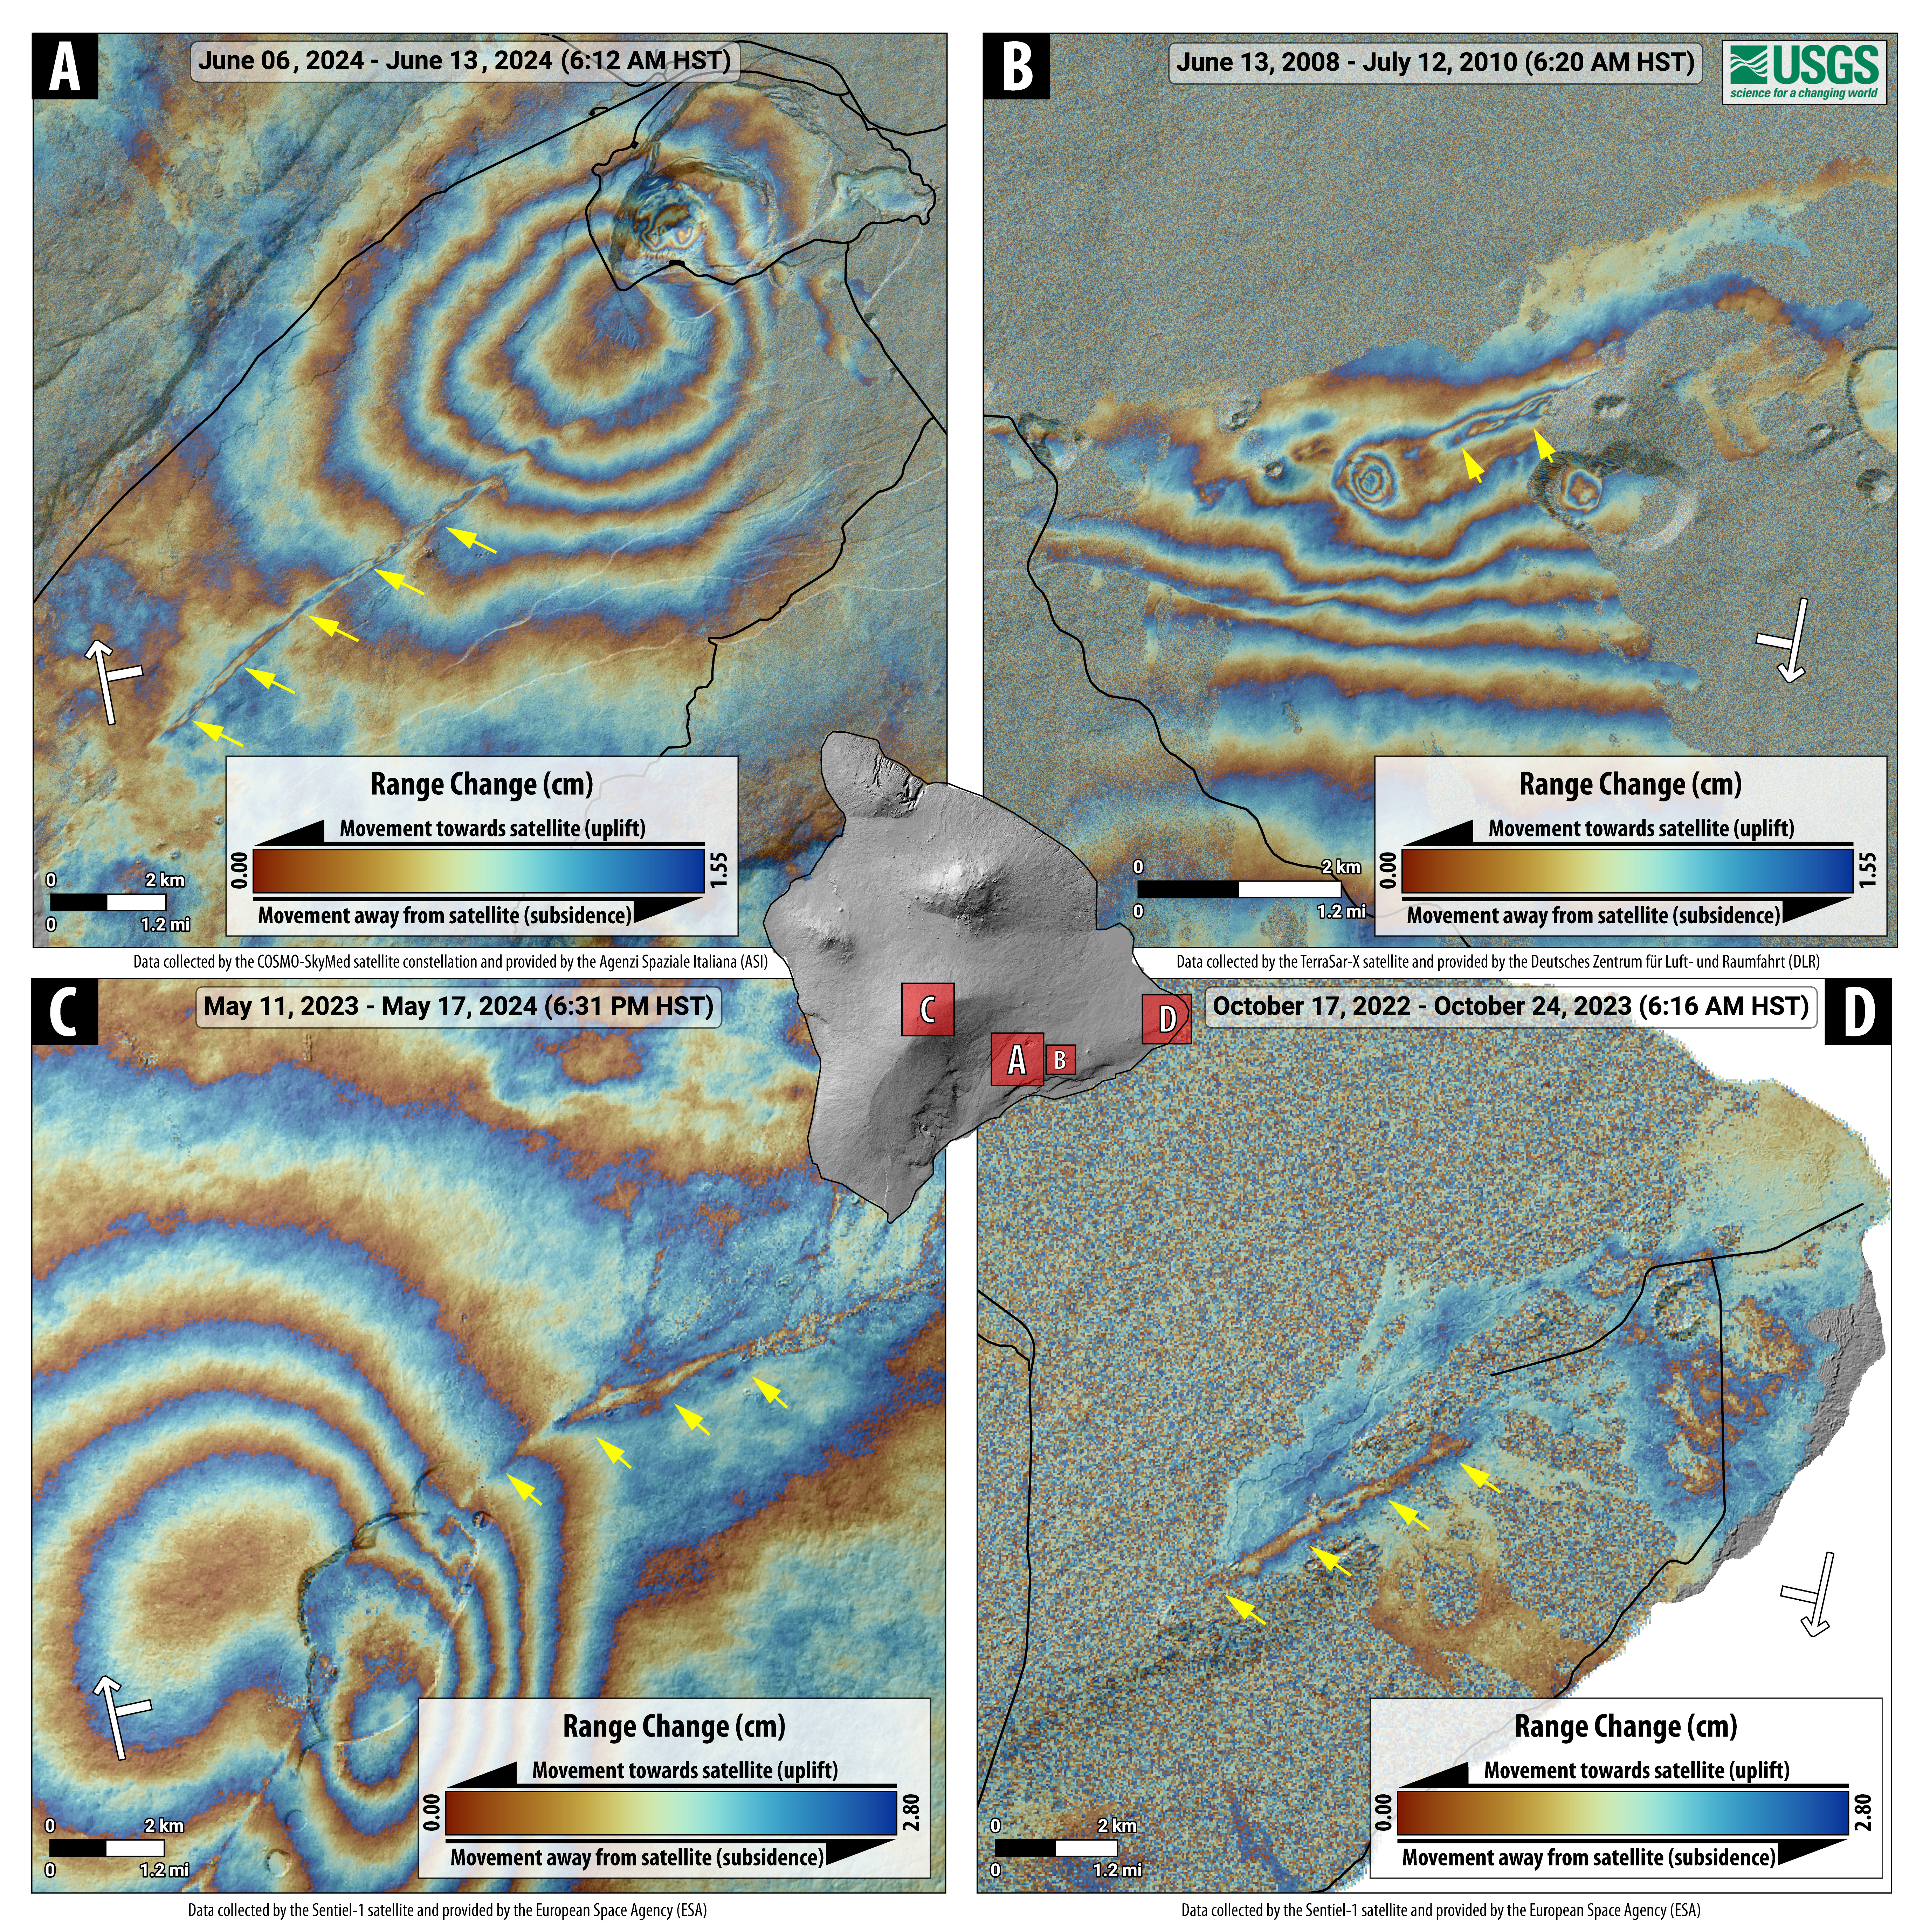
Radar interferograms showing examples of linear subsidence features (indicated by yellow arrows) that occurred directly above recent dike intrusions. (A) COSMO-SkyMed interferogram spanning June 6–13, 2024, showing inflation of Kīlauea’s summit area, but also a narrow and linear zone of subsidence about the Southwest Rift Zone caused by cooling of the dike that feed an eruption on June 3, 2024. (B) TerraSAR-X interferogram spanning June 13, 2008–July 12, 2010, showing complex deformation on Kīlauea’s East Rift Zone near Maunaulu and Makaopuhi Crater. The deformation includes overall contraction of the rift zone, subsidence of former pit craters that were filled by lava in the 1960s (these appear as “bullseyes” of colored fringes), and a linear zone of subsidence above the “Fathers Day” dike, which intruded during Jule 17–19, 2007, and fed a small eruption on the north side of Kānenuiohamo. (C) Sentinel-1 interferogram of the summit region of Mauna Loa spanning May 11, 2023–May 17, 2024, showing overall inflation following the volcano’s 2022 eruption, as well as a narrow, linear zone of subsidence along the Northeast Rift Zone caused by cooling and contraction of the dike intrusion that fed the eruption. (D) Sentinel-1 interferogram of Kīlauea’s lower East Rift Zone spanning October 17, 2022 – October 24, 2023, showing a narrow and linear zone of subsidence above the dike intrusion that fed the 2018 eruption. In all images, the white arrow shows the path of the satellite, with the perpendicular white bar giving the look direction.
Sources/Usage
Public Domain.