
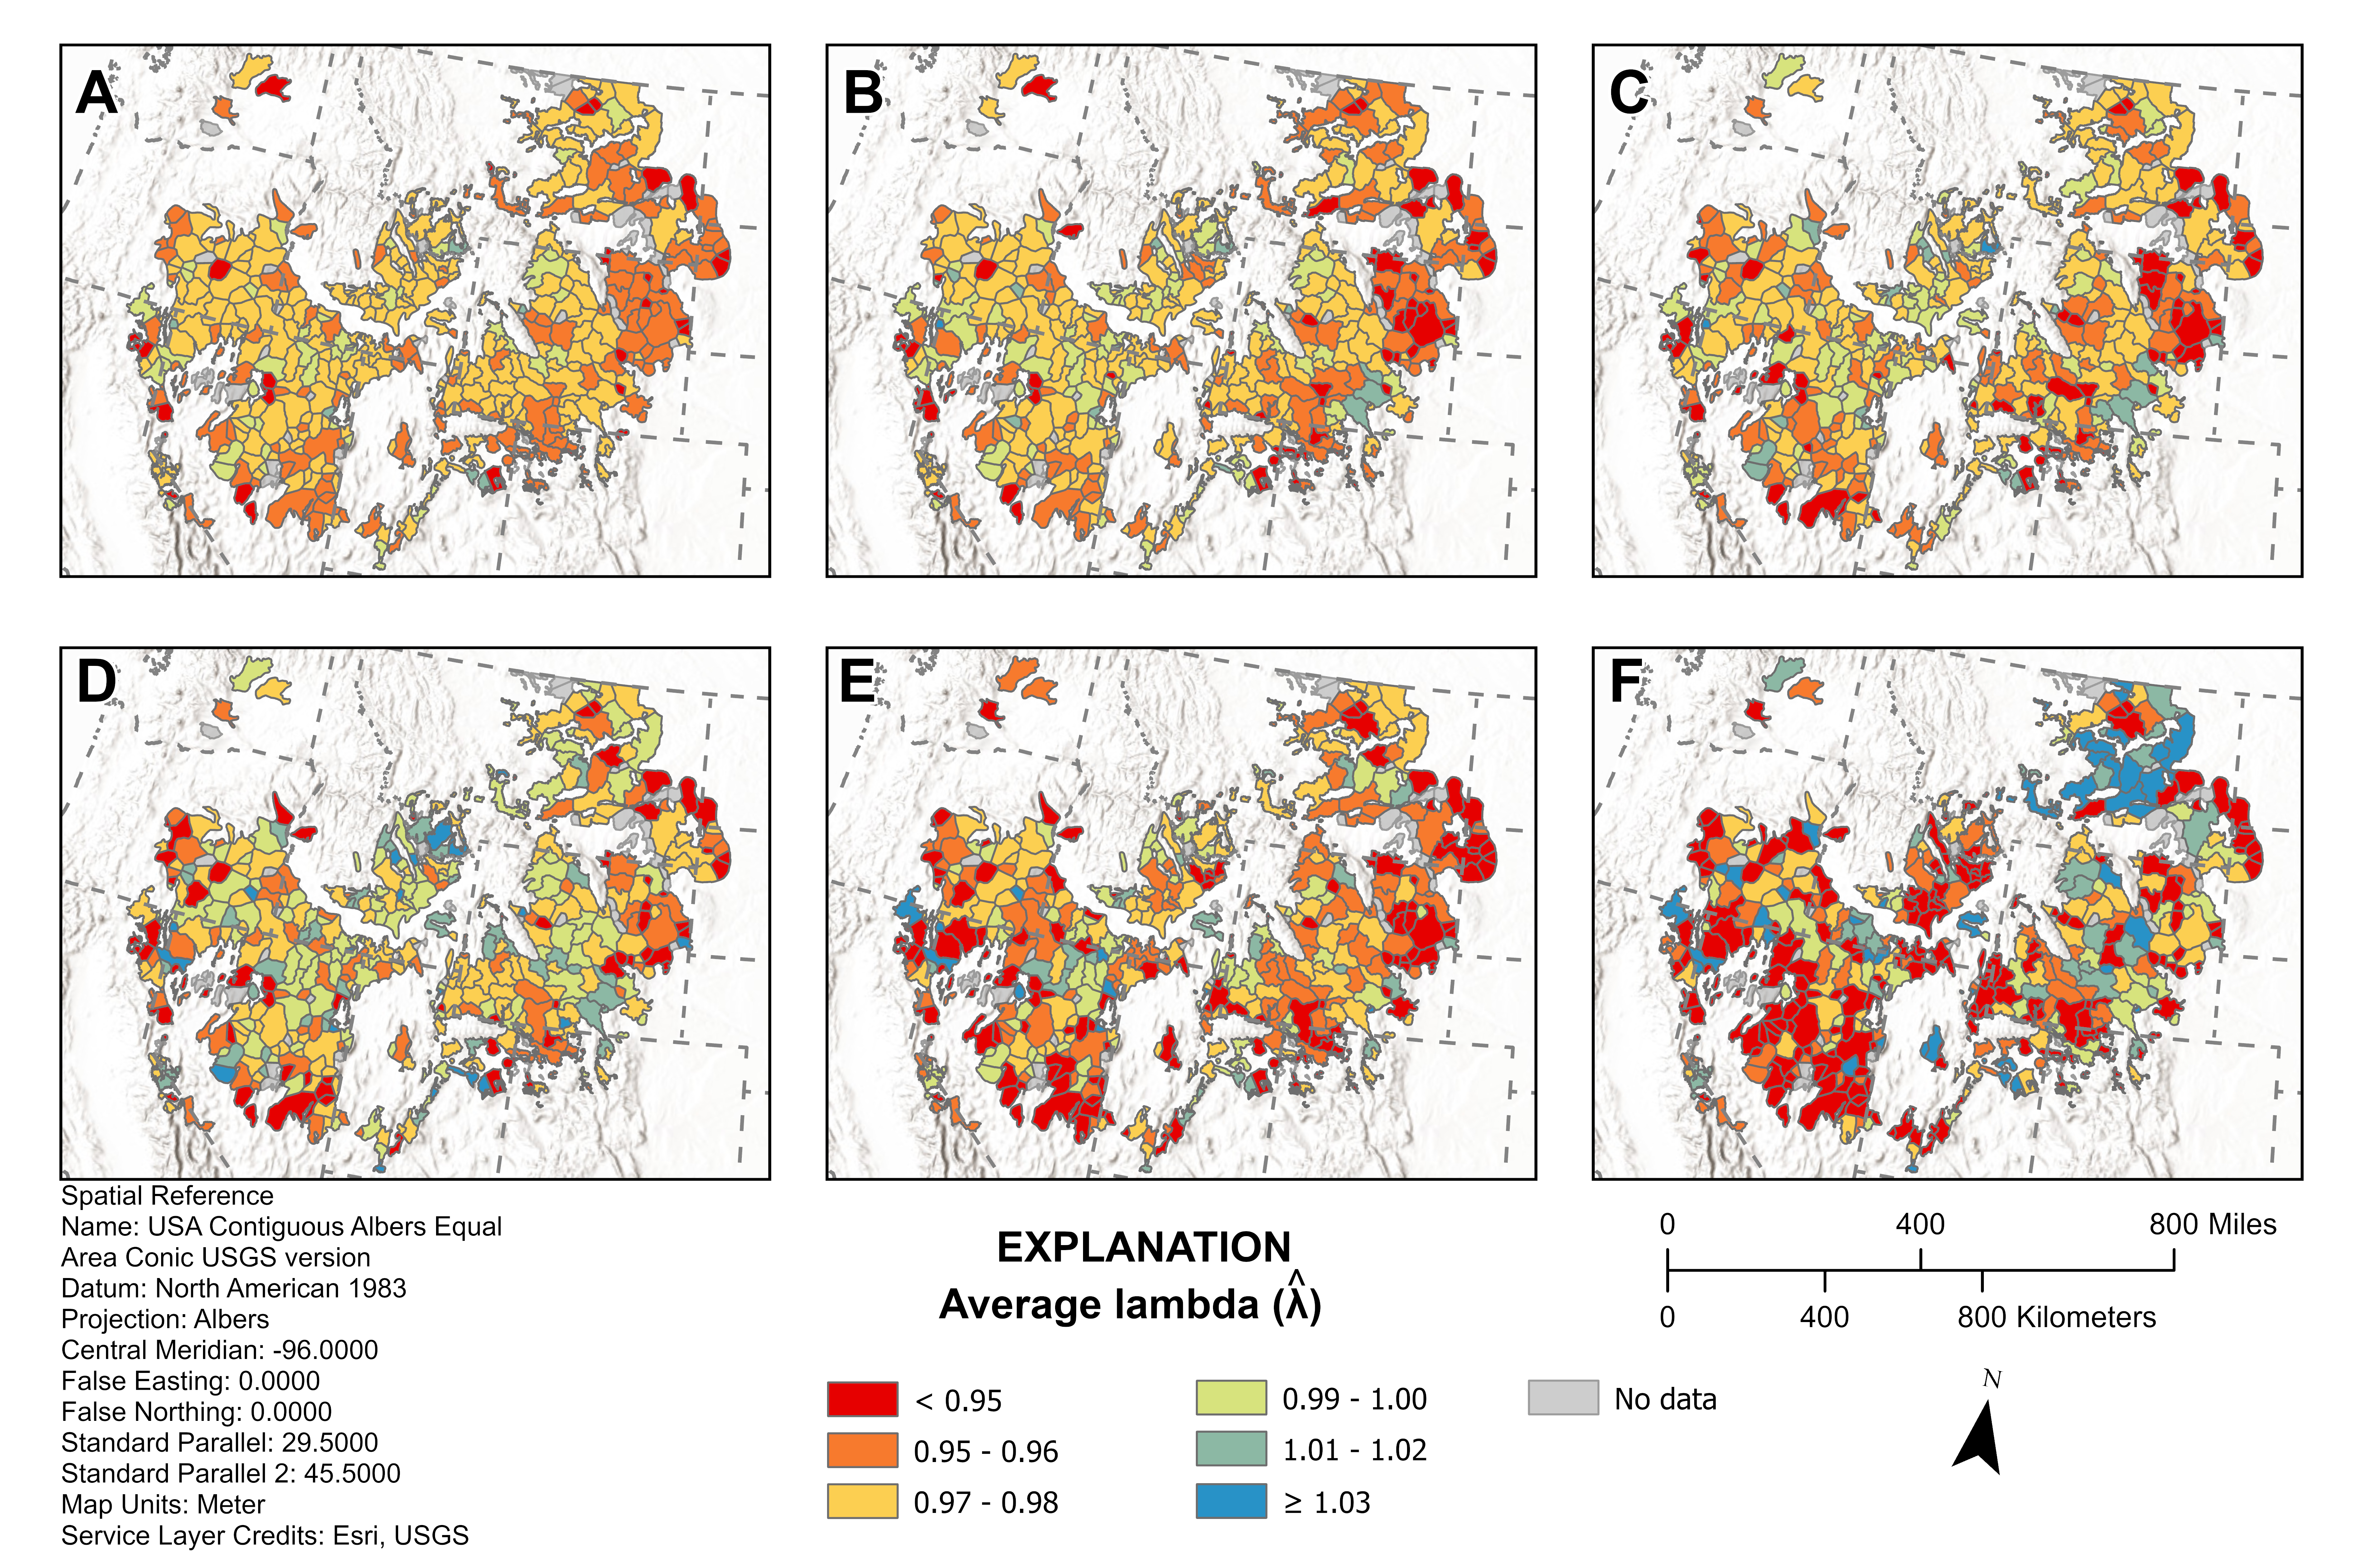
Range-wide spatial estimates of average annual population rate of change in abundance of sage-grouse across six temporal scales based on periods of oscillation
By Fort Collins Science Center
January 2024 (approx.)

Detailed Description
Figure 2: Range-wide spatial estimates of average annual rate of change (λ) in abundance of greater sage-grouse (Centrocercus urophasianus) across six temporal scales based on periods of oscillation: A, Period 1 (six oscillations); B, Period 2 (five oscillations); C, Period 3 (four oscillations); D, Period 4 (three oscillations); E, Period 5 (two oscillations); and F, Period 6 (one oscillation) for each neighborhood cluster.
Sources/Usage
Public Domain.
Related

Greater Sage-Grouse Population Monitoring Framework
Greater sage-grouse ( Centrocercus urophasianus) are at the center of state and national land use policies largely because of their unique life-history traits and their role as an ecological indicator for the health of sagebrush ecosystems. Multiple science centers with the U.S. Geological Survey (USGS) in conjunction with Colorado State University (CSU) have developed the Greater Sage-Grouse...

Estimating trends for greater sage-grouse populations within highly stochastic environments
Land and wildlife managers require accurate estimates of sensitive species’ trends to help guide conservation decisions that maintain biodiversity and promote healthy ecosystems. The U.S. Geological Survey (USGS), in conjunction with Colorado State University (CSU), developed a hierarchical population monitoring framework for managing greater sage-grouse ( Centrocercus urophasianus; sage-grouse)...
Related
Greater Sage-Grouse Population Monitoring Framework
Greater sage-grouse ( Centrocercus urophasianus) are at the center of state and national land use policies largely because of their unique life-history traits and their role as an ecological indicator for the health of sagebrush ecosystems. Multiple science centers with the U.S. Geological Survey (USGS) in conjunction with Colorado State University (CSU) have developed the Greater Sage-Grouse...
Estimating trends for greater sage-grouse populations within highly stochastic environments
Land and wildlife managers require accurate estimates of sensitive species’ trends to help guide conservation decisions that maintain biodiversity and promote healthy ecosystems. The U.S. Geological Survey (USGS), in conjunction with Colorado State University (CSU), developed a hierarchical population monitoring framework for managing greater sage-grouse ( Centrocercus urophasianus; sage-grouse)...