
Simulated heat maps for different soccer positions
By Yellowstone Volcano Observatory
June 2026 (approx.)
Detailed Description
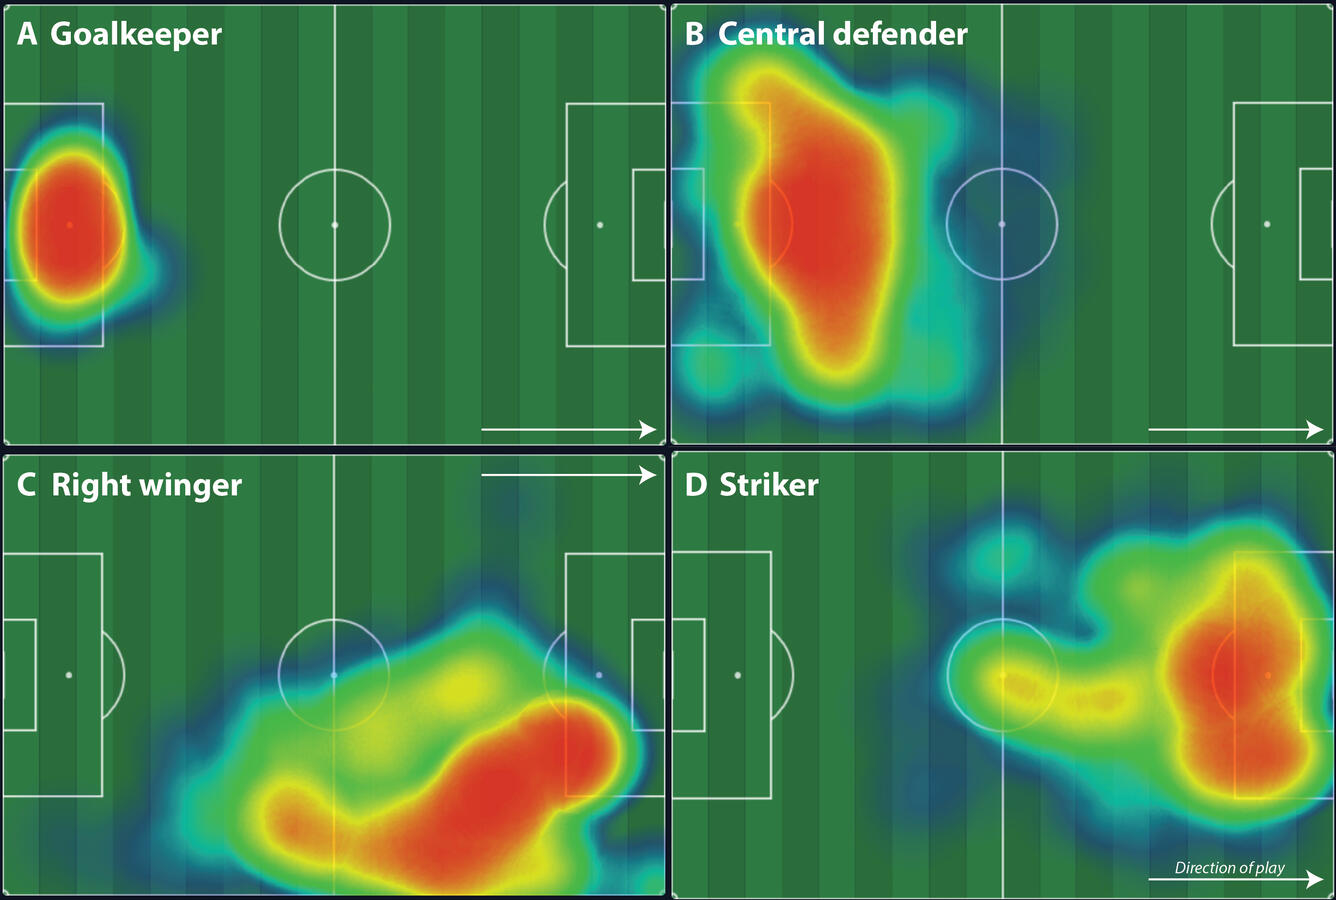
Simulated (not from actual data) soccer heat maps for different positions: (A) goalkeeper, (B) central defender, (C) right winger, and (D) striker. Overlain on a green soccer field background, warmer colors (red/orange) represent areas of more activity or location frequency, while cooler colors (green/cyan/blue) represent areas with low activity or location frequency. For each heat map, the direction of play is left to right.
Sources/Usage
Public Domain.