



Soccer field overlain on Grand Prismatic Spring in Yellowstone National Park (background image from Google Earth).
Richard Gregory Vaughan, PhD
I am a research scientist who specializes in using remote sensing tools and techniques to study dynamic geologic and environmental processes, with an emphasis on volcanic and geothermal phenomena.
Originally from Charlottesville, VA, I attended Virginia Tech (BS Geology, 1992); then went to grad school at the University of Georgia, where I studied the sulfur isotope geochemistry of seafloor hydrothermal sulfide deposits (black smoker chimneys) and went on a research cruise to the East Pacific Rise to dive in the Alvin submersible (MS 1995). Next, I worked as a field geologist in the mineral exploration / mining industry in Nevada, then returned to academia at the University of Nevada Reno (PhD 2004). My PhD project was focused on using infrared imaging spectroscopy to identify and map surface minerals associated with active geothermal systems, hydrothermal alteration, and acid mine drainage.
In October 2004, I started a Caltech postdoc at NASA’s Jet Propulsion Lab in Pasadena, CA. Coincident with my first day on the job, Mount St Helens began a renewed lava dome eruption that lasted until 2008. Fortuitously, there was a NASA remote sensing aircraft in the region, ready to acquire high-resolution visible, thermal infrared, and LiDAR data in the Cascades. So, I hit the ground running, applying remote sensing expertise to study something that had long been an interest: active volcanism. Ever since, my research has focused on the remote characterization of thermal emission from active volcanic and geothermal areas.
I started at the USGS in 2008 as a Mendenhall postdoc, studying thermal activity in Yellowstone using satellite thermal infrared data. I am now the remote sensing team lead for the Yellowstone Volcano Observatory and work closely with the National Park Service to use a combination of aerospace remote sensing observations and field work to map, measure, and monitor Yellowstone’s dynamic thermal areas. My goal is to better understand how thermal and gas emissions are related to (1) other signs of volcanic unrest (e.g., ground deformation and earthquakes), and (2) potentially hazardous volcanic / geothermal processes (e.g., hydrothermal explosions and vegetation kills). I also work on projects with other USGS volcano observatories, the Geothermal Resource Investigations Project, the Volcano Disaster Assistance Program, and am a member of the Landsat Science Team.
In addition to scientific research, I work to support and promote effective science communication to public audiences. In addition to past teaching experiences at Pasadena City College, Cal State Northridge, and Northern Arizona University, I am the outreach coordinator for the USGS Flagstaff Science Campus.
Science and Products

Planetary Volcanology
The USGS Astrogeology Science Center conducts research on planetary volcanology. Volcanism is a key part of the chemical and thermal evolution of planetary bodies, and volcanic eruptions are one of the fundamental processes that create and alter the surface of planetary bodies. We often study volcanoes on Earth in order to better understand eruptions across the Solar System, but we also bring...

Terrestrial Analogs for Research and Geologic Exploration Training (TARGET)
The U. S. Geological Survey (USGS) Astrogeology Science Center (ASC) recently established the Terrestrial Analogs for Research and Geologic Exploration Training (TARGET) program. This service-oriented program is built around the recognition that the Earth is a fundamental training ground for human and robotic planetary exploration, and that ASC is in a unique position in northern Arizona with...
Filter Total Items: 29
Soccer field overlain on Grand Prismatic Spring
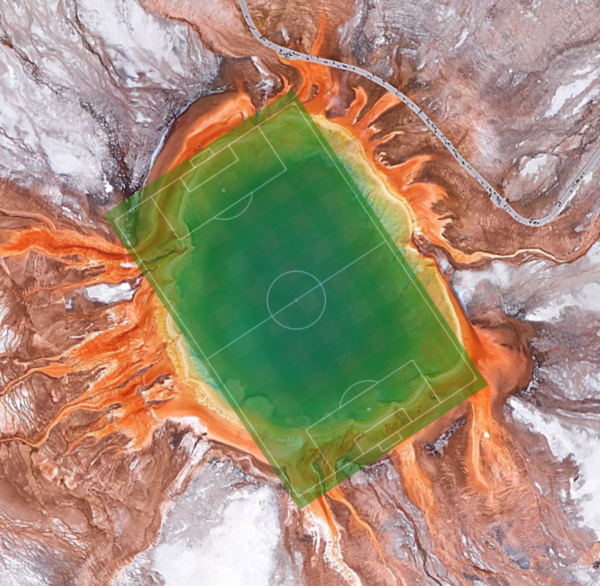
Soccer field overlain on Grand Prismatic Spring in Yellowstone National Park (background image from Google Earth).
Simulated heat maps for different soccer positions
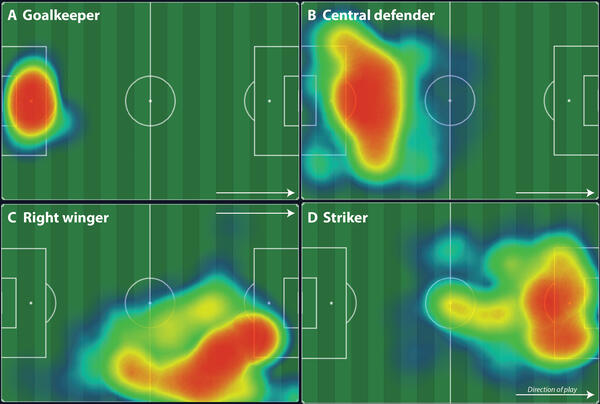
Simulated heat maps for different soccer positionsSimulated (not from actual data) soccer heat maps for different positions: (A) goalkeeper, (B) central defender, (C) right winger, and (D) striker.
Simulated heat maps for different soccer positions
Simulated heat maps for different soccer positionsSimulated (not from actual data) soccer heat maps for different positions: (A) goalkeeper, (B) central defender, (C) right winger, and (D) striker.
Mapping thermal input to Fern Lake, Yellowstone National Park, using satellite imagery
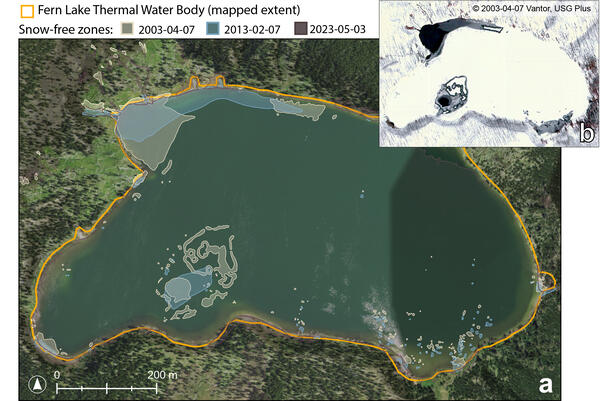
Mapping thermal input to Fern Lake, Yellowstone National Park, using satellite imagery(a) NAIP (National Agriculture Imagery Program) natural-color aerial photograph of Fern Lake, in the east part of Yellowstone National Park, from July 17, 2022, showing mapped locations of liquid water during the winter when the rest of the water body was iced over. The mapped boundary of the lake is indicated by the orange outline, with shaded areas noting re
Mapping thermal input to Fern Lake, Yellowstone National Park, using satellite imagery
Mapping thermal input to Fern Lake, Yellowstone National Park, using satellite imagery(a) NAIP (National Agriculture Imagery Program) natural-color aerial photograph of Fern Lake, in the east part of Yellowstone National Park, from July 17, 2022, showing mapped locations of liquid water during the winter when the rest of the water body was iced over. The mapped boundary of the lake is indicated by the orange outline, with shaded areas noting re
Satellite mapping of thermal ground at Secret Valley Hot Springs, Yellowstone National Park
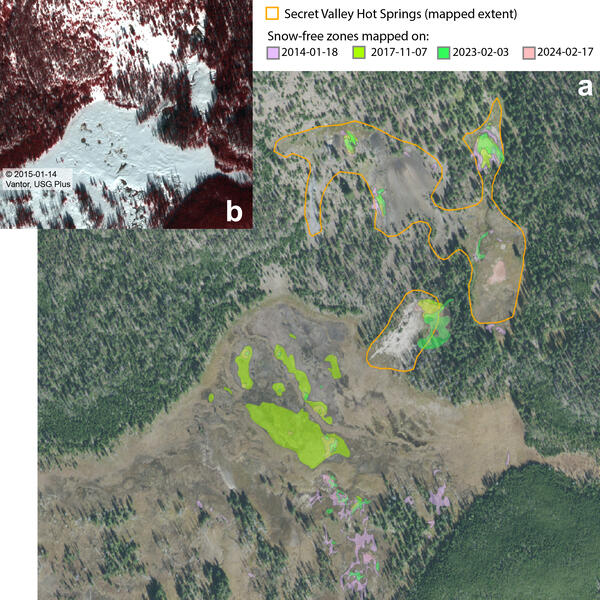
Satellite mapping of thermal ground at Secret Valley Hot Springs, Yellowstone National Park(a) NAIP (National Agriculture Imagery Program) natural-color aerial photograph of Secret Valley Hot Springs, in the backcountry between Norris Geyser Basin and Madison Junction, from September 25, 2015, showing snow-free zone mapping based on snowy wintertime imagery from multiple years. The mapped boundaries of the thermal area are indicated by the orange out
Satellite mapping of thermal ground at Secret Valley Hot Springs, Yellowstone National Park
Satellite mapping of thermal ground at Secret Valley Hot Springs, Yellowstone National Park(a) NAIP (National Agriculture Imagery Program) natural-color aerial photograph of Secret Valley Hot Springs, in the backcountry between Norris Geyser Basin and Madison Junction, from September 25, 2015, showing snow-free zone mapping based on snowy wintertime imagery from multiple years. The mapped boundaries of the thermal area are indicated by the orange out
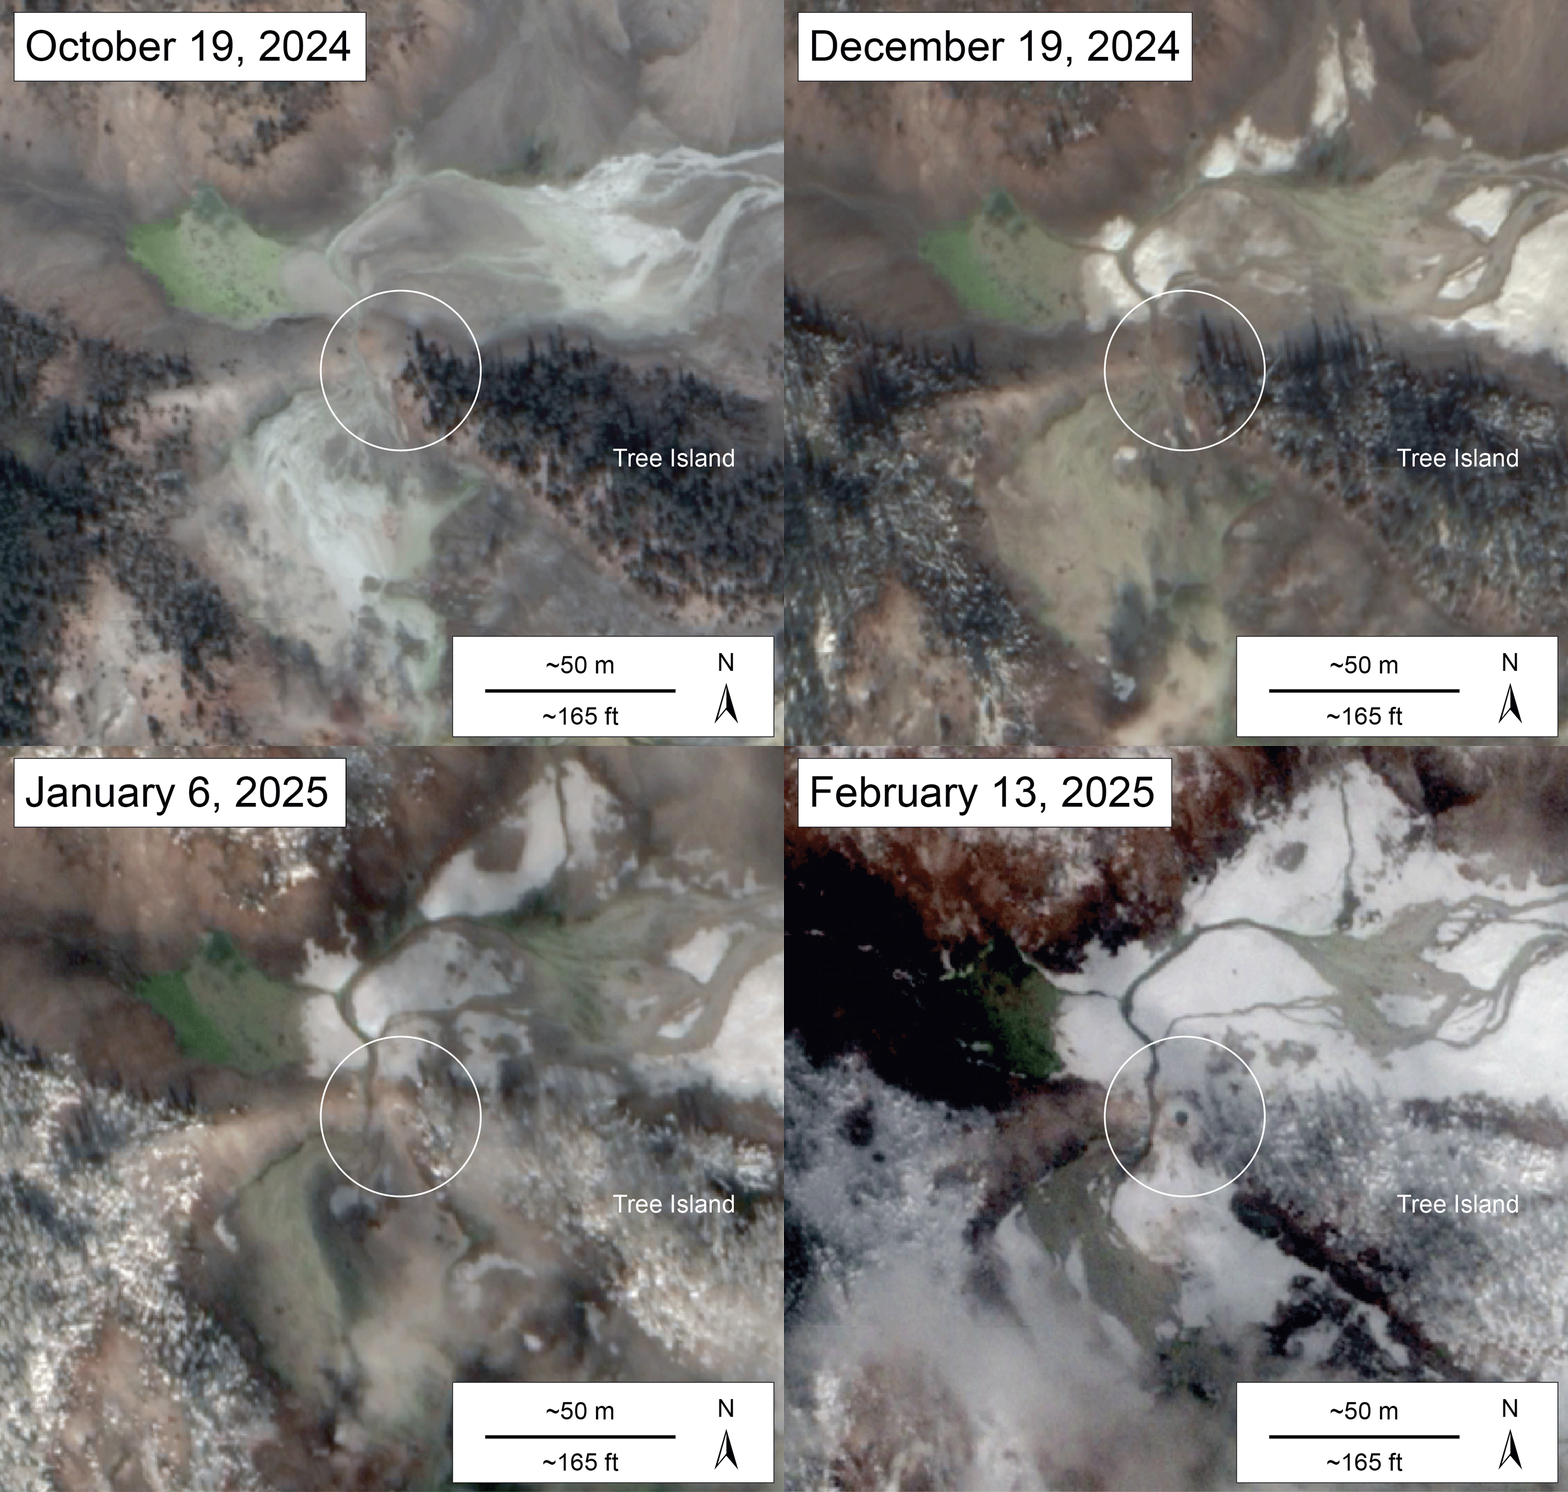
Animated GIF of the development of a new hydrothermal feature during late 2024 to early 2024, Norris Geyser Basin, Yellowstone National Park
Animated GIF of the development of a new hydrothermal feature during late 2024 to early 2024, Norris Geyser Basin, Yellowstone National ParkAnimated GIF of high-resolution satellite images of the Porcelain Basin area of Norris Geyser Basin, Yellowstone National Park, showing the development of a new thermal pool in the circled area. There is no indication of the pool in images from October 19 and December 19, 2024. A small depression is visible in the January 6, 2025, image. In the Feb
Animated GIF of the development of a new hydrothermal feature during late 2024 to early 2024, Norris Geyser Basin, Yellowstone National Park
Animated GIF of the development of a new hydrothermal feature during late 2024 to early 2024, Norris Geyser Basin, Yellowstone National ParkAnimated GIF of high-resolution satellite images of the Porcelain Basin area of Norris Geyser Basin, Yellowstone National Park, showing the development of a new thermal pool in the circled area. There is no indication of the pool in images from October 19 and December 19, 2024. A small depression is visible in the January 6, 2025, image. In the Feb

Map of Yellowstone thermal areas with insets showing high-resolution satellite views of selected regions
Map of Yellowstone thermal areas with insets showing high-resolution satellite views of selected regionsMap of Yellowstone’s thermal areas. Inset commercial satellite images highlight thermal areas that are mentioned below: Sulphur Hills (©2022, Maxar, USG), Turbid Lake (©2022, Maxar, USG), and Lower Geyser Basin (©2015, Maxar, USG). This work utilized data made available through the NASA Commercial SmallSat Data Acquisition Program. We acknowledge th
Map of Yellowstone thermal areas with insets showing high-resolution satellite views of selected regions
Map of Yellowstone thermal areas with insets showing high-resolution satellite views of selected regionsMap of Yellowstone’s thermal areas. Inset commercial satellite images highlight thermal areas that are mentioned below: Sulphur Hills (©2022, Maxar, USG), Turbid Lake (©2022, Maxar, USG), and Lower Geyser Basin (©2015, Maxar, USG). This work utilized data made available through the NASA Commercial SmallSat Data Acquisition Program. We acknowledge th

Map of thermal areas in Yellowstone National Park (2024)
Map of thermal areas in Yellowstone National Park (2024)Map of thermal areas from ground-based mapping and remote-sensing methods compiled by Vaughn et al., 2024 (https://www.sciencebase.gov/catalog/item/661d5eb7d34e7eb9eb7e3a41).
Map of thermal areas in Yellowstone National Park (2024)
Map of thermal areas in Yellowstone National Park (2024)Map of thermal areas from ground-based mapping and remote-sensing methods compiled by Vaughn et al., 2024 (https://www.sciencebase.gov/catalog/item/661d5eb7d34e7eb9eb7e3a41).

Satellite images of Nupahr Lake, Norris Geyser Basin, in 2024
Satellite images of Nupahr Lake, Norris Geyser Basin, in 2024High-resolution satellite images of Norris Geyser Basin showing the area of Porcelain Basin and Nuphar Lake (both images cover the same area). In the left image, acquired on April 2, 2024, springs on Porcelain Terrace are full of water, and warm hydrothermal water is flowing into Nuphar Lake from the area circled in yellow. This warm water kept the north
Satellite images of Nupahr Lake, Norris Geyser Basin, in 2024
Satellite images of Nupahr Lake, Norris Geyser Basin, in 2024High-resolution satellite images of Norris Geyser Basin showing the area of Porcelain Basin and Nuphar Lake (both images cover the same area). In the left image, acquired on April 2, 2024, springs on Porcelain Terrace are full of water, and warm hydrothermal water is flowing into Nuphar Lake from the area circled in yellow. This warm water kept the north
Satellite images of Biscuit Basin, Yellowstone National Park, before and after the July 23, 2024, hydrothermal explosion
Satellite images of Biscuit Basin, Yellowstone National Park, before and after the July 23, 2024, hydrothermal explosionThese satellite images, acquired by Planet, show Biscuit Basin, Yellowstone National Park, before and after the July 23, 2024, hydrothermal explosion. The before image is from July 21, 2024, and the after image is from July 24, 2024.
Satellite images of Biscuit Basin, Yellowstone National Park, before and after the July 23, 2024, hydrothermal explosion
Satellite images of Biscuit Basin, Yellowstone National Park, before and after the July 23, 2024, hydrothermal explosionThese satellite images, acquired by Planet, show Biscuit Basin, Yellowstone National Park, before and after the July 23, 2024, hydrothermal explosion. The before image is from July 21, 2024, and the after image is from July 24, 2024.

High-resolution Planet satellite image of Biscuit Basin, Yellowstone National Park, from July 24, 2024
High-resolution Planet satellite image of Biscuit Basin, Yellowstone National Park, from July 24, 2024High-resolution Planet satellite image of Biscuit Basin, Yellowstone National Park, from July 24, 2024. The image shows changes that occurred as a result of the July 23, 2024, hydrothermal explosion from Black Diamond Pool, including deposition of material in the vicinity of the pool and a plume of discolored water in the Forehole River.
High-resolution Planet satellite image of Biscuit Basin, Yellowstone National Park, from July 24, 2024
High-resolution Planet satellite image of Biscuit Basin, Yellowstone National Park, from July 24, 2024High-resolution Planet satellite image of Biscuit Basin, Yellowstone National Park, from July 24, 2024. The image shows changes that occurred as a result of the July 23, 2024, hydrothermal explosion from Black Diamond Pool, including deposition of material in the vicinity of the pool and a plume of discolored water in the Forehole River.

High-resolution Planet satellite image of Biscuit Basin, Yellowstone National Park, from July 21, 2024
High-resolution Planet satellite image of Biscuit Basin, Yellowstone National Park, from July 21, 2024High-resolution Planet satellite image of Biscuit Basin, Yellowstone National Park, from July 21, 2024. This work utilized data made available through the NASA Commercial Smallsat Data Acquisition (CSDA) Program. Data are copyright, Planet Labs Inc. 2024, all rights reserved.
High-resolution Planet satellite image of Biscuit Basin, Yellowstone National Park, from July 21, 2024
High-resolution Planet satellite image of Biscuit Basin, Yellowstone National Park, from July 21, 2024High-resolution Planet satellite image of Biscuit Basin, Yellowstone National Park, from July 21, 2024. This work utilized data made available through the NASA Commercial Smallsat Data Acquisition (CSDA) Program. Data are copyright, Planet Labs Inc. 2024, all rights reserved.

High-resolution satellite images of Norris Geyser Basin showing the area of Porcelain Basin and Nuphar Lake in April 2024
High-resolution satellite images of Norris Geyser Basin showing the area of Porcelain Basin and Nuphar Lake in April 2024High-resolution satellite images of Norris Geyser Basin showing the area of Porcelain Basin and Nuphar Lake in April 2024. In the left image, acquired on April 2, 2024, springs on Porcelain Terrace are full of water, and warm hydrothermal water is flowing into Nuphar Lake, keeping the north part of the lake free of ice. Boardwalks in the area appear as w
High-resolution satellite images of Norris Geyser Basin showing the area of Porcelain Basin and Nuphar Lake in April 2024
High-resolution satellite images of Norris Geyser Basin showing the area of Porcelain Basin and Nuphar Lake in April 2024High-resolution satellite images of Norris Geyser Basin showing the area of Porcelain Basin and Nuphar Lake in April 2024. In the left image, acquired on April 2, 2024, springs on Porcelain Terrace are full of water, and warm hydrothermal water is flowing into Nuphar Lake, keeping the north part of the lake free of ice. Boardwalks in the area appear as w

Total geothermal radiant power output from Yellowstone thermal areas based on Landsat 8 and Landsat 9 thermal infrared images from 2014 to 2024
Total geothermal radiant power output from Yellowstone thermal areas based on Landsat 8 and Landsat 9 thermal infrared images from 2014 to 2024Plot showing the total geothermal radiant power output from Yellowstone’s thermal areas based on Landsat 8 and Landsat 9 thermal infrared images from 2014 to 2024. Only data from clear, nighttime, wintertime (November through March) dates were used. The results indicate that there has been no significant change over the last 10 years.
Total geothermal radiant power output from Yellowstone thermal areas based on Landsat 8 and Landsat 9 thermal infrared images from 2014 to 2024
Total geothermal radiant power output from Yellowstone thermal areas based on Landsat 8 and Landsat 9 thermal infrared images from 2014 to 2024Plot showing the total geothermal radiant power output from Yellowstone’s thermal areas based on Landsat 8 and Landsat 9 thermal infrared images from 2014 to 2024. Only data from clear, nighttime, wintertime (November through March) dates were used. The results indicate that there has been no significant change over the last 10 years.

High-resolution satellite images of the Porcelain Basin and Nuphar Lake areas of Norris Geyser Basin
High-resolution satellite images of the Porcelain Basin and Nuphar Lake areas of Norris Geyser BasinHigh-resolution satellite images of the Porcelain Basin and Nuphar Lake areas of Norris Geyser Basin acquired by Quickbird-2 on September 11, 2006 (left), WorldView-3 on July 7, 2016 (middle), and WorldView-3 on March 30, 2022 (right). Note the change in color of Nuphar lake, from deep green to light blue, over time, as well as the increased evidence of flow f
High-resolution satellite images of the Porcelain Basin and Nuphar Lake areas of Norris Geyser Basin
High-resolution satellite images of the Porcelain Basin and Nuphar Lake areas of Norris Geyser BasinHigh-resolution satellite images of the Porcelain Basin and Nuphar Lake areas of Norris Geyser Basin acquired by Quickbird-2 on September 11, 2006 (left), WorldView-3 on July 7, 2016 (middle), and WorldView-3 on March 30, 2022 (right). Note the change in color of Nuphar lake, from deep green to light blue, over time, as well as the increased evidence of flow f

Animated GIF of the Porcelain Basin and Nuphar Lake areas of Norris Geyser Basin
Animated GIF of the Porcelain Basin and Nuphar Lake areas of Norris Geyser BasinHigh-resolution satellite images of the Porcelain Basin and Nuphar Lake areas of Norris Geyser Basin acquired by Quickbird-2 on September 11, 2006 and WorldView-3 on March 30, 2022. Note the change in color of Nuphar lake, from deep green to light blue, over time, as well as the increased evidence of flow from thermal features on the east side of Porcelain Bas
Animated GIF of the Porcelain Basin and Nuphar Lake areas of Norris Geyser Basin
Animated GIF of the Porcelain Basin and Nuphar Lake areas of Norris Geyser BasinHigh-resolution satellite images of the Porcelain Basin and Nuphar Lake areas of Norris Geyser Basin acquired by Quickbird-2 on September 11, 2006 and WorldView-3 on March 30, 2022. Note the change in color of Nuphar lake, from deep green to light blue, over time, as well as the increased evidence of flow from thermal features on the east side of Porcelain Bas
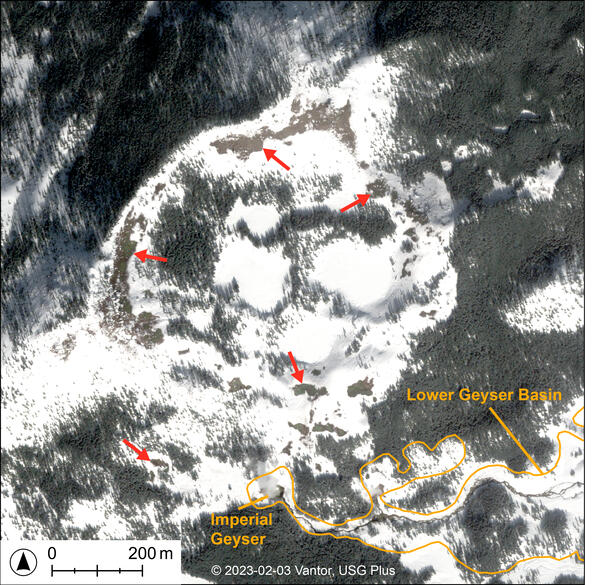
Subtle thermal ground revealed by wintertime satellite imagery of Twin Buttes, Yellowstone National Park
Subtle thermal ground revealed by wintertime satellite imagery of Twin Buttes, Yellowstone National ParkWorldView-2 natural-color satellite image from February 3, 2023, showing snow-free zones around Twin Buttes, just beyond the southwest portion of Lower Geyser Basin. At the time and date this image was acquired, there was extensive
Subtle thermal ground revealed by wintertime satellite imagery of Twin Buttes, Yellowstone National Park
Subtle thermal ground revealed by wintertime satellite imagery of Twin Buttes, Yellowstone National ParkWorldView-2 natural-color satellite image from February 3, 2023, showing snow-free zones around Twin Buttes, just beyond the southwest portion of Lower Geyser Basin. At the time and date this image was acquired, there was extensive

Landsat 8 nighttime thermal infrared image of Yellowstone National Park from January 31, 2023
Landsat 8 nighttime thermal infrared image of Yellowstone National Park from January 31, 2023Landsat 8 nighttime thermal infrared image of Yellowstone National Park from January 31, 2023. Satellite-based thermal infrared data show areas on the surface that are warmer versus cooler, and they can be used to estimate surface temperature and the geothermal radiative heat output from the Yellowstone magmatic and hydrothermal system.
Landsat 8 nighttime thermal infrared image of Yellowstone National Park from January 31, 2023
Landsat 8 nighttime thermal infrared image of Yellowstone National Park from January 31, 2023Landsat 8 nighttime thermal infrared image of Yellowstone National Park from January 31, 2023. Satellite-based thermal infrared data show areas on the surface that are warmer versus cooler, and they can be used to estimate surface temperature and the geothermal radiative heat output from the Yellowstone magmatic and hydrothermal system.

Images of an unnamed thermal feature in the Three River Junction thermal area in southwest Yellowstone National Park
Images of an unnamed thermal feature in the Three River Junction thermal area in southwest Yellowstone National ParkImages of an unnamed thermal feature in the Three River Junction thermal area in southwest Yellowstone National Park. A, WorldView-3 satellite image from September 2014. B, National Park Service (NPS) aerial photograph from 2017. Images A and B were acquired before the feature went largely dry in late 2019 or 2020. C, WorldView-3 satellite image from June 2020.
Images of an unnamed thermal feature in the Three River Junction thermal area in southwest Yellowstone National Park
Images of an unnamed thermal feature in the Three River Junction thermal area in southwest Yellowstone National ParkImages of an unnamed thermal feature in the Three River Junction thermal area in southwest Yellowstone National Park. A, WorldView-3 satellite image from September 2014. B, National Park Service (NPS) aerial photograph from 2017. Images A and B were acquired before the feature went largely dry in late 2019 or 2020. C, WorldView-3 satellite image from June 2020.

Landsat 8 thermal infrared images of Yellowstone showing daily and seasonal differences.
Landsat 8 thermal infrared images of Yellowstone showing daily and seasonal differences.Landsat 8 thermal infrared images of Yellowstone showing daily and seasonal differences. In these greyscale images, bright pixels are warmer and dark pixels are cooler. In the daytime images (A and C), you can see the effects of topography, with darker (cooler) pixels like shadows on north-facing slopes and brighter (warmer) pixels on sun-facing slopes.&
Landsat 8 thermal infrared images of Yellowstone showing daily and seasonal differences.
Landsat 8 thermal infrared images of Yellowstone showing daily and seasonal differences.Landsat 8 thermal infrared images of Yellowstone showing daily and seasonal differences. In these greyscale images, bright pixels are warmer and dark pixels are cooler. In the daytime images (A and C), you can see the effects of topography, with darker (cooler) pixels like shadows on north-facing slopes and brighter (warmer) pixels on sun-facing slopes.&

Map of Yellowstone National Park showing geologic structures and thermal areas
Map of Yellowstone National Park showing geologic structures and thermal areasMap of Yellowstone National Park showing geologic structures, including the caldera, inner ring fault, and resurgent domes, and and thermal areas (colored red).
Map of Yellowstone National Park showing geologic structures and thermal areas
Map of Yellowstone National Park showing geologic structures and thermal areasMap of Yellowstone National Park showing geologic structures, including the caldera, inner ring fault, and resurgent domes, and and thermal areas (colored red).

Landsat 8 nighttime thermal infrared image of Yellowstone from 28 January 2022
Landsat 8 nighttime thermal infrared image of Yellowstone from 28 January 2022Landsat 8 nighttime thermal infrared image of Yellowstone from 28 January 2022. Inset images are zoomed in on the area outlined by the white square. Inset image (A) has the raw data values, which range from 9070 to 21284. Inset image (B) shows the same image converted to spectral radiance, where values range from 3.13 to 7.21 W/m2/micron
Landsat 8 nighttime thermal infrared image of Yellowstone from 28 January 2022
Landsat 8 nighttime thermal infrared image of Yellowstone from 28 January 2022Landsat 8 nighttime thermal infrared image of Yellowstone from 28 January 2022. Inset images are zoomed in on the area outlined by the white square. Inset image (A) has the raw data values, which range from 9070 to 21284. Inset image (B) shows the same image converted to spectral radiance, where values range from 3.13 to 7.21 W/m2/micron
Science and Products
Planetary Volcanology
The USGS Astrogeology Science Center conducts research on planetary volcanology. Volcanism is a key part of the chemical and thermal evolution of planetary bodies, and volcanic eruptions are one of the fundamental processes that create and alter the surface of planetary bodies. We often study volcanoes on Earth in order to better understand eruptions across the Solar System, but we also bring...
Terrestrial Analogs for Research and Geologic Exploration Training (TARGET)
The U. S. Geological Survey (USGS) Astrogeology Science Center (ASC) recently established the Terrestrial Analogs for Research and Geologic Exploration Training (TARGET) program. This service-oriented program is built around the recognition that the Earth is a fundamental training ground for human and robotic planetary exploration, and that ASC is in a unique position in northern Arizona with...
Filter Total Items: 29
Soccer field overlain on Grand Prismatic Spring
Soccer field overlain on Grand Prismatic Spring in Yellowstone National Park (background image from Google Earth).
Soccer field overlain on Grand Prismatic Spring in Yellowstone National Park (background image from Google Earth).
Simulated heat maps for different soccer positions
Simulated heat maps for different soccer positionsSimulated (not from actual data) soccer heat maps for different positions: (A) goalkeeper, (B) central defender, (C) right winger, and (D) striker.
Simulated heat maps for different soccer positions
Simulated heat maps for different soccer positionsSimulated (not from actual data) soccer heat maps for different positions: (A) goalkeeper, (B) central defender, (C) right winger, and (D) striker.
Mapping thermal input to Fern Lake, Yellowstone National Park, using satellite imagery
Mapping thermal input to Fern Lake, Yellowstone National Park, using satellite imagery(a) NAIP (National Agriculture Imagery Program) natural-color aerial photograph of Fern Lake, in the east part of Yellowstone National Park, from July 17, 2022, showing mapped locations of liquid water during the winter when the rest of the water body was iced over. The mapped boundary of the lake is indicated by the orange outline, with shaded areas noting re
Mapping thermal input to Fern Lake, Yellowstone National Park, using satellite imagery
Mapping thermal input to Fern Lake, Yellowstone National Park, using satellite imagery(a) NAIP (National Agriculture Imagery Program) natural-color aerial photograph of Fern Lake, in the east part of Yellowstone National Park, from July 17, 2022, showing mapped locations of liquid water during the winter when the rest of the water body was iced over. The mapped boundary of the lake is indicated by the orange outline, with shaded areas noting re
Satellite mapping of thermal ground at Secret Valley Hot Springs, Yellowstone National Park
Satellite mapping of thermal ground at Secret Valley Hot Springs, Yellowstone National Park(a) NAIP (National Agriculture Imagery Program) natural-color aerial photograph of Secret Valley Hot Springs, in the backcountry between Norris Geyser Basin and Madison Junction, from September 25, 2015, showing snow-free zone mapping based on snowy wintertime imagery from multiple years. The mapped boundaries of the thermal area are indicated by the orange out
Satellite mapping of thermal ground at Secret Valley Hot Springs, Yellowstone National Park
Satellite mapping of thermal ground at Secret Valley Hot Springs, Yellowstone National Park(a) NAIP (National Agriculture Imagery Program) natural-color aerial photograph of Secret Valley Hot Springs, in the backcountry between Norris Geyser Basin and Madison Junction, from September 25, 2015, showing snow-free zone mapping based on snowy wintertime imagery from multiple years. The mapped boundaries of the thermal area are indicated by the orange out
Animated GIF of the development of a new hydrothermal feature during late 2024 to early 2024, Norris Geyser Basin, Yellowstone National Park
Animated GIF of the development of a new hydrothermal feature during late 2024 to early 2024, Norris Geyser Basin, Yellowstone National ParkAnimated GIF of high-resolution satellite images of the Porcelain Basin area of Norris Geyser Basin, Yellowstone National Park, showing the development of a new thermal pool in the circled area. There is no indication of the pool in images from October 19 and December 19, 2024. A small depression is visible in the January 6, 2025, image. In the Feb
Animated GIF of the development of a new hydrothermal feature during late 2024 to early 2024, Norris Geyser Basin, Yellowstone National Park
Animated GIF of the development of a new hydrothermal feature during late 2024 to early 2024, Norris Geyser Basin, Yellowstone National ParkAnimated GIF of high-resolution satellite images of the Porcelain Basin area of Norris Geyser Basin, Yellowstone National Park, showing the development of a new thermal pool in the circled area. There is no indication of the pool in images from October 19 and December 19, 2024. A small depression is visible in the January 6, 2025, image. In the Feb
Map of Yellowstone thermal areas with insets showing high-resolution satellite views of selected regions
Map of Yellowstone thermal areas with insets showing high-resolution satellite views of selected regionsMap of Yellowstone’s thermal areas. Inset commercial satellite images highlight thermal areas that are mentioned below: Sulphur Hills (©2022, Maxar, USG), Turbid Lake (©2022, Maxar, USG), and Lower Geyser Basin (©2015, Maxar, USG). This work utilized data made available through the NASA Commercial SmallSat Data Acquisition Program. We acknowledge th
Map of Yellowstone thermal areas with insets showing high-resolution satellite views of selected regions
Map of Yellowstone thermal areas with insets showing high-resolution satellite views of selected regionsMap of Yellowstone’s thermal areas. Inset commercial satellite images highlight thermal areas that are mentioned below: Sulphur Hills (©2022, Maxar, USG), Turbid Lake (©2022, Maxar, USG), and Lower Geyser Basin (©2015, Maxar, USG). This work utilized data made available through the NASA Commercial SmallSat Data Acquisition Program. We acknowledge th
Map of thermal areas in Yellowstone National Park (2024)
Map of thermal areas in Yellowstone National Park (2024)Map of thermal areas from ground-based mapping and remote-sensing methods compiled by Vaughn et al., 2024 (https://www.sciencebase.gov/catalog/item/661d5eb7d34e7eb9eb7e3a41).
Map of thermal areas in Yellowstone National Park (2024)
Map of thermal areas in Yellowstone National Park (2024)Map of thermal areas from ground-based mapping and remote-sensing methods compiled by Vaughn et al., 2024 (https://www.sciencebase.gov/catalog/item/661d5eb7d34e7eb9eb7e3a41).
Satellite images of Nupahr Lake, Norris Geyser Basin, in 2024
Satellite images of Nupahr Lake, Norris Geyser Basin, in 2024High-resolution satellite images of Norris Geyser Basin showing the area of Porcelain Basin and Nuphar Lake (both images cover the same area). In the left image, acquired on April 2, 2024, springs on Porcelain Terrace are full of water, and warm hydrothermal water is flowing into Nuphar Lake from the area circled in yellow. This warm water kept the north
Satellite images of Nupahr Lake, Norris Geyser Basin, in 2024
Satellite images of Nupahr Lake, Norris Geyser Basin, in 2024High-resolution satellite images of Norris Geyser Basin showing the area of Porcelain Basin and Nuphar Lake (both images cover the same area). In the left image, acquired on April 2, 2024, springs on Porcelain Terrace are full of water, and warm hydrothermal water is flowing into Nuphar Lake from the area circled in yellow. This warm water kept the north
Satellite images of Biscuit Basin, Yellowstone National Park, before and after the July 23, 2024, hydrothermal explosion
Satellite images of Biscuit Basin, Yellowstone National Park, before and after the July 23, 2024, hydrothermal explosionThese satellite images, acquired by Planet, show Biscuit Basin, Yellowstone National Park, before and after the July 23, 2024, hydrothermal explosion. The before image is from July 21, 2024, and the after image is from July 24, 2024.
Satellite images of Biscuit Basin, Yellowstone National Park, before and after the July 23, 2024, hydrothermal explosion
Satellite images of Biscuit Basin, Yellowstone National Park, before and after the July 23, 2024, hydrothermal explosionThese satellite images, acquired by Planet, show Biscuit Basin, Yellowstone National Park, before and after the July 23, 2024, hydrothermal explosion. The before image is from July 21, 2024, and the after image is from July 24, 2024.
High-resolution Planet satellite image of Biscuit Basin, Yellowstone National Park, from July 24, 2024
High-resolution Planet satellite image of Biscuit Basin, Yellowstone National Park, from July 24, 2024High-resolution Planet satellite image of Biscuit Basin, Yellowstone National Park, from July 24, 2024. The image shows changes that occurred as a result of the July 23, 2024, hydrothermal explosion from Black Diamond Pool, including deposition of material in the vicinity of the pool and a plume of discolored water in the Forehole River.
High-resolution Planet satellite image of Biscuit Basin, Yellowstone National Park, from July 24, 2024
High-resolution Planet satellite image of Biscuit Basin, Yellowstone National Park, from July 24, 2024High-resolution Planet satellite image of Biscuit Basin, Yellowstone National Park, from July 24, 2024. The image shows changes that occurred as a result of the July 23, 2024, hydrothermal explosion from Black Diamond Pool, including deposition of material in the vicinity of the pool and a plume of discolored water in the Forehole River.
High-resolution Planet satellite image of Biscuit Basin, Yellowstone National Park, from July 21, 2024
High-resolution Planet satellite image of Biscuit Basin, Yellowstone National Park, from July 21, 2024High-resolution Planet satellite image of Biscuit Basin, Yellowstone National Park, from July 21, 2024. This work utilized data made available through the NASA Commercial Smallsat Data Acquisition (CSDA) Program. Data are copyright, Planet Labs Inc. 2024, all rights reserved.
High-resolution Planet satellite image of Biscuit Basin, Yellowstone National Park, from July 21, 2024
High-resolution Planet satellite image of Biscuit Basin, Yellowstone National Park, from July 21, 2024High-resolution Planet satellite image of Biscuit Basin, Yellowstone National Park, from July 21, 2024. This work utilized data made available through the NASA Commercial Smallsat Data Acquisition (CSDA) Program. Data are copyright, Planet Labs Inc. 2024, all rights reserved.
High-resolution satellite images of Norris Geyser Basin showing the area of Porcelain Basin and Nuphar Lake in April 2024
High-resolution satellite images of Norris Geyser Basin showing the area of Porcelain Basin and Nuphar Lake in April 2024High-resolution satellite images of Norris Geyser Basin showing the area of Porcelain Basin and Nuphar Lake in April 2024. In the left image, acquired on April 2, 2024, springs on Porcelain Terrace are full of water, and warm hydrothermal water is flowing into Nuphar Lake, keeping the north part of the lake free of ice. Boardwalks in the area appear as w
High-resolution satellite images of Norris Geyser Basin showing the area of Porcelain Basin and Nuphar Lake in April 2024
High-resolution satellite images of Norris Geyser Basin showing the area of Porcelain Basin and Nuphar Lake in April 2024High-resolution satellite images of Norris Geyser Basin showing the area of Porcelain Basin and Nuphar Lake in April 2024. In the left image, acquired on April 2, 2024, springs on Porcelain Terrace are full of water, and warm hydrothermal water is flowing into Nuphar Lake, keeping the north part of the lake free of ice. Boardwalks in the area appear as w
Total geothermal radiant power output from Yellowstone thermal areas based on Landsat 8 and Landsat 9 thermal infrared images from 2014 to 2024
Total geothermal radiant power output from Yellowstone thermal areas based on Landsat 8 and Landsat 9 thermal infrared images from 2014 to 2024Plot showing the total geothermal radiant power output from Yellowstone’s thermal areas based on Landsat 8 and Landsat 9 thermal infrared images from 2014 to 2024. Only data from clear, nighttime, wintertime (November through March) dates were used. The results indicate that there has been no significant change over the last 10 years.
Total geothermal radiant power output from Yellowstone thermal areas based on Landsat 8 and Landsat 9 thermal infrared images from 2014 to 2024
Total geothermal radiant power output from Yellowstone thermal areas based on Landsat 8 and Landsat 9 thermal infrared images from 2014 to 2024Plot showing the total geothermal radiant power output from Yellowstone’s thermal areas based on Landsat 8 and Landsat 9 thermal infrared images from 2014 to 2024. Only data from clear, nighttime, wintertime (November through March) dates were used. The results indicate that there has been no significant change over the last 10 years.
High-resolution satellite images of the Porcelain Basin and Nuphar Lake areas of Norris Geyser Basin
High-resolution satellite images of the Porcelain Basin and Nuphar Lake areas of Norris Geyser BasinHigh-resolution satellite images of the Porcelain Basin and Nuphar Lake areas of Norris Geyser Basin acquired by Quickbird-2 on September 11, 2006 (left), WorldView-3 on July 7, 2016 (middle), and WorldView-3 on March 30, 2022 (right). Note the change in color of Nuphar lake, from deep green to light blue, over time, as well as the increased evidence of flow f
High-resolution satellite images of the Porcelain Basin and Nuphar Lake areas of Norris Geyser Basin
High-resolution satellite images of the Porcelain Basin and Nuphar Lake areas of Norris Geyser BasinHigh-resolution satellite images of the Porcelain Basin and Nuphar Lake areas of Norris Geyser Basin acquired by Quickbird-2 on September 11, 2006 (left), WorldView-3 on July 7, 2016 (middle), and WorldView-3 on March 30, 2022 (right). Note the change in color of Nuphar lake, from deep green to light blue, over time, as well as the increased evidence of flow f
Animated GIF of the Porcelain Basin and Nuphar Lake areas of Norris Geyser Basin
Animated GIF of the Porcelain Basin and Nuphar Lake areas of Norris Geyser BasinHigh-resolution satellite images of the Porcelain Basin and Nuphar Lake areas of Norris Geyser Basin acquired by Quickbird-2 on September 11, 2006 and WorldView-3 on March 30, 2022. Note the change in color of Nuphar lake, from deep green to light blue, over time, as well as the increased evidence of flow from thermal features on the east side of Porcelain Bas
Animated GIF of the Porcelain Basin and Nuphar Lake areas of Norris Geyser Basin
Animated GIF of the Porcelain Basin and Nuphar Lake areas of Norris Geyser BasinHigh-resolution satellite images of the Porcelain Basin and Nuphar Lake areas of Norris Geyser Basin acquired by Quickbird-2 on September 11, 2006 and WorldView-3 on March 30, 2022. Note the change in color of Nuphar lake, from deep green to light blue, over time, as well as the increased evidence of flow from thermal features on the east side of Porcelain Bas
Subtle thermal ground revealed by wintertime satellite imagery of Twin Buttes, Yellowstone National Park
Subtle thermal ground revealed by wintertime satellite imagery of Twin Buttes, Yellowstone National ParkWorldView-2 natural-color satellite image from February 3, 2023, showing snow-free zones around Twin Buttes, just beyond the southwest portion of Lower Geyser Basin. At the time and date this image was acquired, there was extensive
Subtle thermal ground revealed by wintertime satellite imagery of Twin Buttes, Yellowstone National Park
Subtle thermal ground revealed by wintertime satellite imagery of Twin Buttes, Yellowstone National ParkWorldView-2 natural-color satellite image from February 3, 2023, showing snow-free zones around Twin Buttes, just beyond the southwest portion of Lower Geyser Basin. At the time and date this image was acquired, there was extensive
Landsat 8 nighttime thermal infrared image of Yellowstone National Park from January 31, 2023
Landsat 8 nighttime thermal infrared image of Yellowstone National Park from January 31, 2023Landsat 8 nighttime thermal infrared image of Yellowstone National Park from January 31, 2023. Satellite-based thermal infrared data show areas on the surface that are warmer versus cooler, and they can be used to estimate surface temperature and the geothermal radiative heat output from the Yellowstone magmatic and hydrothermal system.
Landsat 8 nighttime thermal infrared image of Yellowstone National Park from January 31, 2023
Landsat 8 nighttime thermal infrared image of Yellowstone National Park from January 31, 2023Landsat 8 nighttime thermal infrared image of Yellowstone National Park from January 31, 2023. Satellite-based thermal infrared data show areas on the surface that are warmer versus cooler, and they can be used to estimate surface temperature and the geothermal radiative heat output from the Yellowstone magmatic and hydrothermal system.
Images of an unnamed thermal feature in the Three River Junction thermal area in southwest Yellowstone National Park
Images of an unnamed thermal feature in the Three River Junction thermal area in southwest Yellowstone National ParkImages of an unnamed thermal feature in the Three River Junction thermal area in southwest Yellowstone National Park. A, WorldView-3 satellite image from September 2014. B, National Park Service (NPS) aerial photograph from 2017. Images A and B were acquired before the feature went largely dry in late 2019 or 2020. C, WorldView-3 satellite image from June 2020.
Images of an unnamed thermal feature in the Three River Junction thermal area in southwest Yellowstone National Park
Images of an unnamed thermal feature in the Three River Junction thermal area in southwest Yellowstone National ParkImages of an unnamed thermal feature in the Three River Junction thermal area in southwest Yellowstone National Park. A, WorldView-3 satellite image from September 2014. B, National Park Service (NPS) aerial photograph from 2017. Images A and B were acquired before the feature went largely dry in late 2019 or 2020. C, WorldView-3 satellite image from June 2020.
Landsat 8 thermal infrared images of Yellowstone showing daily and seasonal differences.
Landsat 8 thermal infrared images of Yellowstone showing daily and seasonal differences.Landsat 8 thermal infrared images of Yellowstone showing daily and seasonal differences. In these greyscale images, bright pixels are warmer and dark pixels are cooler. In the daytime images (A and C), you can see the effects of topography, with darker (cooler) pixels like shadows on north-facing slopes and brighter (warmer) pixels on sun-facing slopes.&
Landsat 8 thermal infrared images of Yellowstone showing daily and seasonal differences.
Landsat 8 thermal infrared images of Yellowstone showing daily and seasonal differences.Landsat 8 thermal infrared images of Yellowstone showing daily and seasonal differences. In these greyscale images, bright pixels are warmer and dark pixels are cooler. In the daytime images (A and C), you can see the effects of topography, with darker (cooler) pixels like shadows on north-facing slopes and brighter (warmer) pixels on sun-facing slopes.&
Map of Yellowstone National Park showing geologic structures and thermal areas
Map of Yellowstone National Park showing geologic structures and thermal areasMap of Yellowstone National Park showing geologic structures, including the caldera, inner ring fault, and resurgent domes, and and thermal areas (colored red).
Map of Yellowstone National Park showing geologic structures and thermal areas
Map of Yellowstone National Park showing geologic structures and thermal areasMap of Yellowstone National Park showing geologic structures, including the caldera, inner ring fault, and resurgent domes, and and thermal areas (colored red).
Landsat 8 nighttime thermal infrared image of Yellowstone from 28 January 2022
Landsat 8 nighttime thermal infrared image of Yellowstone from 28 January 2022Landsat 8 nighttime thermal infrared image of Yellowstone from 28 January 2022. Inset images are zoomed in on the area outlined by the white square. Inset image (A) has the raw data values, which range from 9070 to 21284. Inset image (B) shows the same image converted to spectral radiance, where values range from 3.13 to 7.21 W/m2/micron
Landsat 8 nighttime thermal infrared image of Yellowstone from 28 January 2022
Landsat 8 nighttime thermal infrared image of Yellowstone from 28 January 2022Landsat 8 nighttime thermal infrared image of Yellowstone from 28 January 2022. Inset images are zoomed in on the area outlined by the white square. Inset image (A) has the raw data values, which range from 9070 to 21284. Inset image (B) shows the same image converted to spectral radiance, where values range from 3.13 to 7.21 W/m2/micron