
Small-scale map of flow field
Detailed Description
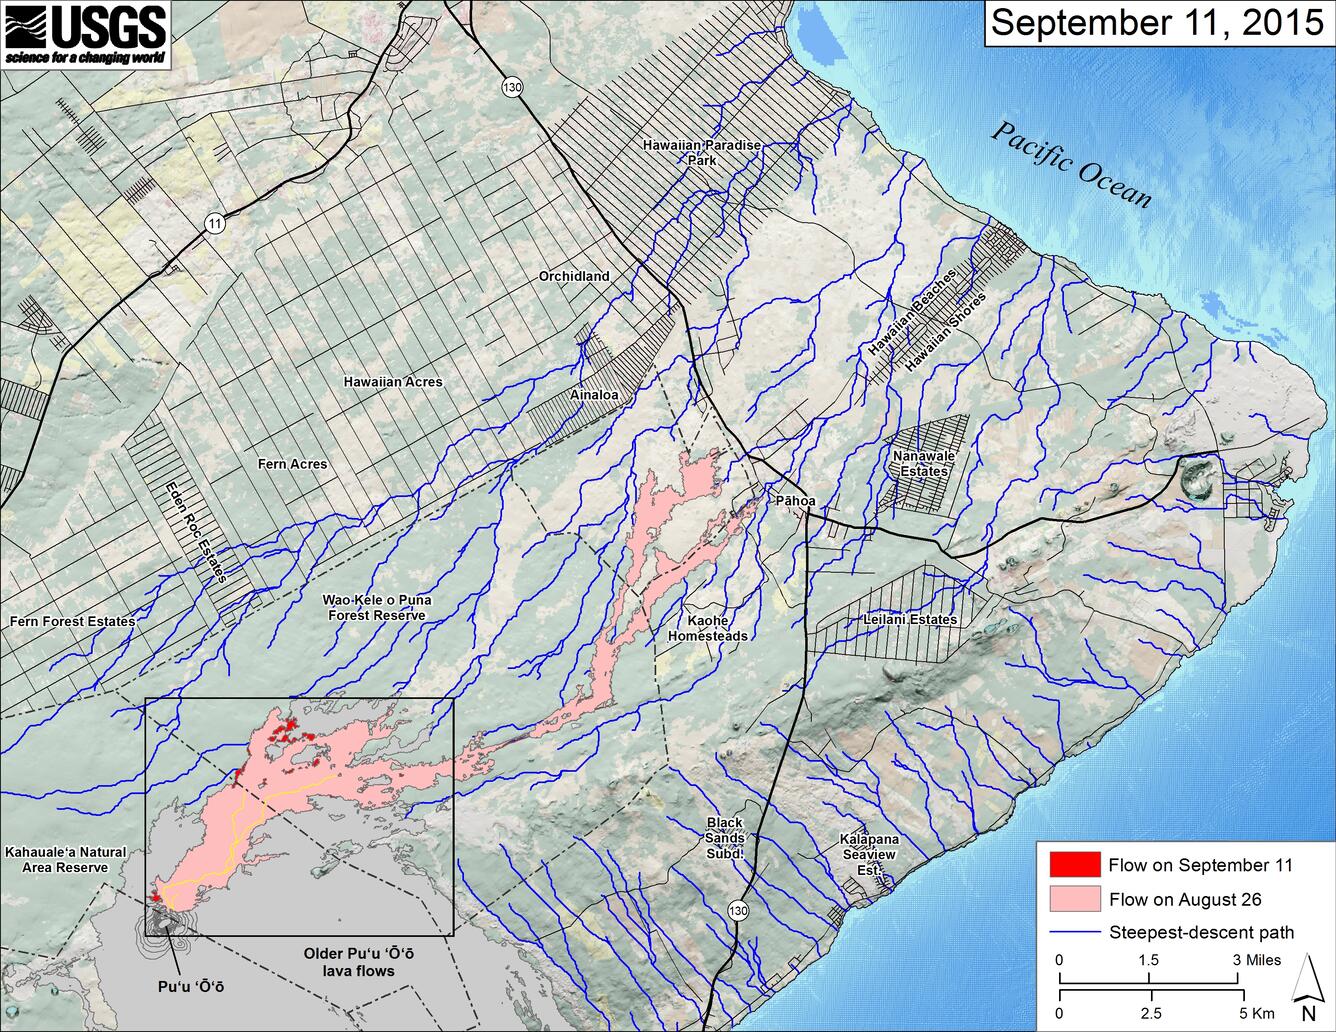
This small-scale map shows Kīlauea's active East Rift Zone lava flow in relation to the eastern part of the Island of Hawai‘i. The area of the flow on August 26 is shown in pink, while widening and advancement of the flow as of September 11 is shown in red. The yellow lines show the active lava tube system. The black box shows the extent of the accompanying large scale map.
The blue lines show steepest-descent paths calculated from a 1983 digital elevation model (DEM; for calculation details, see http://pubs.usgs.gov/of/2007/1264/). Steepest-descent path analysis is based on the assumption that the DEM perfectly represents the earth's surface. DEMs, however, are not perfect, so the blue lines on this map can be used to infer only approximate flow paths. Pu‘u ‘Ō‘ō lava flows erupted prior to June 27, 2014, are shown in gray. The base map is a partly transparent regional land cover map from National Oceanic and Atmospheric Administration (NO‘A‘ā) Office of Coastal Management draped over the 1983 DEM. The bathymetry is also from NO‘A‘ā.
Because the flow field is changing very little at the moment, mapping of the lava flow is being conducted relatively infrequently. We will return to more frequent mapping if warranted by an increase in activity.